
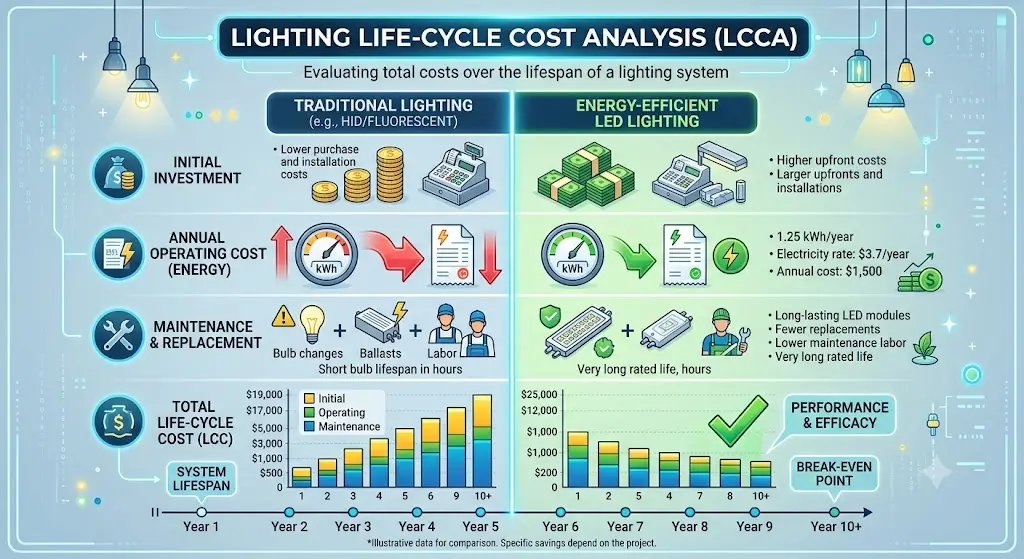
Why Simple Payback Misleads: The 3–7 Year Gap
Simple payback is the default metric for lighting upgrades because it's easy to calculate and easy to explain. It's also systematically wrong in ways that matter for real investment decisions — especially for outdoor lighting systems where technology lifetimes span 15–25 years.
Formula: Net Cost ÷ Annual Savings
- Calculates break-even year only
- Ignores time value of money — $1 saved in year 15 is treated as equal to $1 saved today
- Uses constant energy prices — no escalation
- Often omits maintenance cost changes (relamping, ballast replacement)
- Cannot compare alternatives with different service lives
- Systematically underestimates payback by 3–7 years for LED vs HID comparisons (per ASHS research)
- Appropriate for: Quick initial screening, projects under $5,000 total cost
Formula: LCC = I + Repl − Res + E + OM&R + O (all in present-value $)
- Calculates total present-value cost over the entire study period
- Discounts all future costs to present value using a discount rate
- Models energy price escalation separately from discount rate
- Includes all maintenance events with their timing
- Can compare systems with different lifetimes over a common study period
- Includes supplementary metrics: Net Savings, SIR, AIRR, Discounted Payback
- Appropriate for: Any project over $5,000, commercial retrofits, dark sky compliance decisions, HOA presentation
The Documented Gap: 3–7 Years of Payback Underestimation
Research published in HortTechnology journal documented this gap precisely for LED vs HPS lighting comparisons: "Simple payback predicted a payback period of 7 years, 3 years earlier than the life-cycle cost analysis prediction." The same research found that in some cases, "LCCA shows the project will not pay back in the lifetime of the building, even when simple payback claims it will." The gap is driven by two mechanisms:
- Energy price escalation: Energy prices rise over time. Simple payback uses today's electricity rate to calculate all future energy savings. LCCA applies an escalation rate (typically 2–4% annually for commercial electricity) that compounds each year. For a 20-year comparison, this escalation means year-15 energy savings are worth significantly more in real dollars than simple payback assumes.
- Time value of money: A dollar spent in year 10 is worth less than a dollar spent today, because money invested today grows over time. Simple payback treats all future expenditures equally. LCCA discounts all future costs back to present value — which means the expensive HID relamping event in year 4 costs less in present-value terms than it appears, but the 20-year stream of avoided energy costs is also worth less in present-value terms than simple payback implies.
For the dark sky compliance decision specifically, the gap matters because dark sky compliant fixtures typically have a higher initial cost but lower ongoing costs. Simple payback will always favor the lower-initial-cost option more than LCCA will, because it doesn't account for the compounding advantage of lower energy costs over a 20-year period.
The Complete WBDG LCC Formula for Outdoor Lighting
The Whole Building Design Guide (WBDG) is the federal government's primary building design reference, published by the National Institute of Building Sciences. Its LCCA methodology is the standard for federal building projects and is widely used in commercial construction. The formula is comprehensive and applies directly to outdoor landscape lighting analysis.
How Present Value Discounting Works in Practice
Every future cost in the LCC is discounted back to today's value using the formula: PV = FV ÷ (1 + d)n, where FV is the future value of the cost, d is the real discount rate, and n is the number of years until the cost occurs. For a 3% real discount rate, a $500 ballast replacement in year 8 has a present value of $500 ÷ (1.03)8 = $394.65. A $200 annual energy cost in year 15 has a present value of $200 ÷ (1.03)15 = $128.49.
The energy cost escalation is handled separately: the escalating future energy cost in year n is: En = E0 × (1 + e)n, where e is the energy escalation rate and E0 is the base-year energy cost. The present value of that escalating cost is then En ÷ (1 + d)n. When e > 0, the present value of future energy costs is higher than you'd get by simply multiplying today's rate by years — which is the core reason simple payback understates true costs for energy-saving projects.
Setting the Discount Rate and Energy Escalation Rate
These two rate assumptions have more influence on the LCC result than almost any other input. Common choices:
- Real discount rate: 3–5% for commercial real estate, 2–4% for institutional and government projects, 6–8% for private investment applications. The WBDG recommends the Office of Management and Budget (OMB) discount rates for federal projects, which have historically been 2–4% in real terms.
- Energy escalation rate: EIA (Energy Information Administration) long-run forecasts for commercial electricity have historically averaged 2–3% real annually. For outdoor landscape lighting LCC, using 2.5% as the base case with 1.5% and 4% as sensitivity bounds is defensible.
- A critical asymmetry: When energy prices escalate faster than the discount rate (e > d), the present value of energy savings grows over time rather than shrinking. This is the scenario most favorable to energy-efficient investments — and the scenario most likely in a period of sustained energy price increases.
Technology Profiles: Lamp Life, Wattage, and LCC Component Overview
Four technologies dominate outdoor landscape and commercial site lighting comparisons. Understanding the operational profile of each — rated lamp life, warm-up time, ballast requirements, and maintenance intervals — is the foundation of any credible LCC.
Lamp life: 24,000–28,000 hours (catalog average). In harsh outdoor environments with thermal stress and vibration, field failures typically occur at 8,000–12,000 hours — approximately 2–2.5 years for dusk-to-dawn operation at 4,380 hours/year. Per Hyperlite's documented maintenance analysis: "With a typical lamp life of 8,000 to 12,000 hours, a facility operating dusk-to-dawn will require a relamping event every 2 to 2.5 years." Ballast life: 5–7 years, typically. Warm-up time: 3–5 minutes to full output. Dark period after outage: 1–2 minutes minimum to re-strike. Spectral output: monochromatic yellow-orange (~2000K), very low CRI (~25), provides poor color rendering. Wattage vs useful light: HPS is relatively efficient in lumens-per-watt, but per ScienceDirect LCC analysis of road lighting, energy costs "dominate the LCCs of the HPS lamp installations." Not dark sky friendly — HPS's orange color is actually less disruptive to wildlife than blue-rich white light, but HPS fixtures commonly use non-cutoff optical designs that produce significant uplight.
Lamp life: 10,000–15,000 hours catalog; real-world outdoor failures at 6,000–10,000 hours. At 4,380 dusk-to-dawn annual hours, this means relamping every 1.5–2 years. Ballast life: similar to HPS, 5–7 years. Warm-up time: 2–5 minutes from cold start; 10–20 minutes to re-strike after outage. Spectral output: broad white spectrum, 3000–4200K, good CRI (65–90). Energy consumption: ballasts add 15% to lamp wattage — a 400W MH lamp draws approximately 460W from the supply. Per Luminategroup's analysis: "replacing 20 metal halide lamps (400W each) with 20 LED fixtures (150W each)" produces a 62.5% wattage reduction. Metal halide at 400W fixture wattage (460W with ballast) running 4,380 hours annually consumes 2,014 kWh per fixture per year. At $0.125/kWh, that's $251.75 per fixture per year in electricity alone — before maintenance. HID systems including MH are classified as hazardous waste for disposal due to mercury content in the lamps.
Driver life: 50,000–100,000 hours for quality drivers; per the site's integrated LED lifespan data research, real-world driver failures typically occur at 20,000–30,000 hours driven by electrolytic capacitor degradation — roughly 4.6–6.8 years at 4,380 annual hours. No lamp to replace — integrated LED design; driver failure replaces entire fixture or driver module depending on architecture. No warm-up time. Energy consumption: typically 40–150W for outdoor fixtures that replace 250–400W HID. Per tru-scapes.com documentation: LED landscape lights consume 3–7 watts per fixture in low-voltage systems versus 20–50 watts for halogen. Standard LED fixtures are available in a wide range from 2700K to 6500K, though 4000K–5000K options are common in commercial outdoor specifications. Non-dark-sky-compliant standard LEDs may have significant uplight contributions from non-cutoff optical designs, and blue-rich spectra at 4000K+ create measurable impacts on wildlife and human circadian rhythms per the sustainability cluster guides.
Technical distinctions: IDA Fixture Seal of Approval requires: (1) fully shielded — no light emitted above the horizontal plane; (2) no sag or drop lenses, side light panels, or uplight panels; (3) warm-toned white LED at 3000K maximum or amber LED. Full cutoff optics direct 100% of lumen output downward, eliminating the 30–40% of lumens wasted as uplight and sidewall scatter in non-cutoff designs. This means a dark sky compliant fixture delivering the same useful ground-level footcandle level as a standard fixture can be 30–40% lower wattage — which is the efficiency mechanism that drives the LCC advantage. Driver life: same as standard LED (20,000–30,000 hours real-world for the driver; 50,000+ hours for the LED array). Per the Hornbeck Group's dark sky analysis: "dark-friendly lighting has a longer lifespan due to using high-efficiency LED bulbs that last longer, reducing maintenance and replacement costs over time." The 3000K CCT also means lower blue-spectrum output, which has been documented to attract fewer insects — indirectly reducing the ecological disruption that draws insect-dependent wildlife species into artificial light environments. For dark sky fixture selection guidance, see the dark sky fixture selection guide.
The Energy Cost Component: Where Most of the Money Goes
For HID lighting systems (HPS, metal halide), energy costs represent 60–80% of the 20-year life cycle cost. Understanding how to model this component — particularly the energy escalation rate — is the most important skill in outdoor lighting LCCA.
Climate exposure can change the real ownership cost of outdoor lighting more than the original fixture price. A lower-cost fixture may provide years of service in a shaded inland yard but require repeated replacement when exposed to coastal salt, desert heat, saturated clay soil, or freeze-thaw movement. Before estimating replacement labor and long-term maintenance, use the Outdoor Lighting Climate Performance Guide to identify the climate stressors most likely to shorten the life of drivers, gaskets, connectors, finishes, stakes, lenses, and transformer hardware.
Annual Energy Cost Calculation Per Fixture
The base annual energy cost per fixture is:
The Energy Escalation Effect on 20-Year Present Value
The annual savings don't stay at $169.80. If electricity prices escalate at 2.5% annually, by year 10 the annual savings per fixture are $169.80 × (1.025)10 = $217.19. By year 20, they're $169.80 × (1.025)20 = $277.83. The cumulative undiscounted 20-year energy savings at 2.5% escalation are substantially larger than the simple payback calculation assumes.
This is the energy escalation effect. Using a 3% real discount rate and 2.5% energy escalation rate, the present-value factor for a 20-year stream of escalating annual savings is approximately 18.1 (the modified uniform present worth factor from NIST Handbook 135). For $169.80/fixture/year in base savings, the 20-year PV of energy savings per fixture is: $169.80 × 18.1 = $3,073.38/fixture. This is the number that actually matters for the LCC comparison — not the first-year savings.
How Much the Energy Escalation Rate Changes the Answer
This is the most important sensitivity finding in any lighting LCC. At 0% energy escalation (constant real prices), the 20-year PV of savings is lower. At 4% escalation, it's substantially higher. For the same $169.80/year base savings per fixture at a 3% discount rate:
| Energy Escalation Rate | Modified UPW Factor | 20-yr PV Energy Savings/Fixture | Change vs Base Case |
|---|---|---|---|
| 0% (no escalation) | 14.9 | $2,529 | −$544 vs base |
| 1.5% | 16.7 | $2,836 | −$237 vs base |
| 2.5% (base case) | 18.1 | $3,073 | — base case |
| 3.5% | 19.9 | $3,379 | +$306 vs base |
| 4.0% | 21.0 | $3,566 | +$493 vs base |
The practical takeaway: a 1% change in the energy escalation rate assumption changes the 20-year PV energy savings per fixture by roughly $250–$500. For a 40-fixture commercial installation, this is a $10,000–$20,000 swing in the total LCC comparison. The energy escalation rate assumption is the input that most dramatically changes the LCC conclusion — more than the discount rate, more than the fixture price differential, more than the maintenance interval assumptions. When presenting an LCC to a decision-maker, always present three scenarios (low / base / high energy escalation) rather than a single number.
For detailed energy consumption modeling tools, see the landscape lighting energy calculator and the carbon footprint guide for the emissions side of energy cost modeling.
The Maintenance Cost Component: The HID Cost Cliff
Maintenance costs are the LCC component most frequently underestimated in simple payback analyses and most dramatically different between HID and LED technologies. For HID systems, maintenance follows a predictable staircase pattern — low initial cost followed by steep periodic spikes at relamping events.
HPS and Metal Halide Maintenance Timeline
A dusk-to-dawn HPS or metal halide installation running 4,380 hours annually creates this maintenance cost structure over 20 years:
- Year 2–2.5 (first relamping): Lamp replacement. Per Facilities Management Insights: "Costs can run $4 to $8 per lamp, including a new lamp and disposal of spent lamps. Labor is roughly half that total cost" — so a total lamp-plus-labor cost of approximately $60–$120 per fixture for the maintenance event. For commercial fixtures with higher-wattage lamps and access equipment required, costs per fixture can reach $150–$300.
- Year 5–7 (ballast/driver replacement): Per Hyperlite's wall pack maintenance guide: "The ballast — the electrical heart of the HID fixture — typically fails every 5 to 7 years. Replacing a ballast is a significantly more invasive and expensive procedure than a simple lamp swap, often costing 60% of the price of a brand-new LED fixture in labor alone." A ballast replacement event for a 400W MH fixture typically costs $200–$400 including parts and labor per fixture.
- Year 5 (second relamping): Coinciding with or near the first ballast replacement. In practice, ballast and lamp are often replaced simultaneously when a ballast fails mid-cycle, even if the lamp still has remaining life — creating a combined maintenance event cost of $300–$600 per fixture.
- Years 7–10 (third relamping, second ballast if first failed late): The HID system enters an expensive maintenance phase where both relamping and ballast replacement may occur within the same 3-year window.
Group Relamping vs Spot Relamping
HID installations face a maintenance strategy choice that significantly affects LCC. Per Facilities Management Insights: "Several studies have shown that scheduled group relamping may cut overall lighting costs compared to spot relamping as units burn out. One analysis found that the service paid for itself about 2 years into the usual 3 to 5-year relamping cycle." The logic: a service visit to replace a single failed lamp costs nearly as much in travel time and setup as a visit to replace 20 lamps. Group relamping (replacing all lamps at a scheduled interval regardless of individual failures) reduces per-lamp labor costs but means some lamps with remaining life are discarded.
For LCC purposes, model maintenance using a group relamping assumption: one maintenance event per 2–3 years for HPS/MH systems at an average cost of $80–$120 per fixture (lamp cost + pro-rated labor across the group), plus one ballast replacement event at year 6–8 at $250–$400 per fixture.
LED System Maintenance Profile
LED outdoor systems theoretically require no relamping — the LED array is rated for 50,000–100,000 hours. The maintenance profile for quality outdoor LED systems consists of:
- Annual: Lens cleaning to address lumen depreciation from dirt accumulation (primarily in environments with dust, pollen, or particulate). Estimated $15–$30 per fixture annually for professional cleaning as part of an annual maintenance contract.
- Connection inspection: Annual or biennial inspection and re-tightening of wire connections, particularly in direct-burial landscape lighting applications where thermal cycling causes connection movement. Part of transformer maintenance visit.
- Driver replacement (years 5–7 for integrated designs): Per the site's integrated LED lifespan data: real-world electrolytic capacitor failures in LED drivers occur at 20,000–30,000 hours — approximately 4.6–6.8 years at 4,380 annual operating hours. For fixtures with replaceable driver modules, the replacement cost is $40–$80 per driver plus $20–$40 labor. For integrated canless LED fixtures, the entire fixture replaces — $80–$150 per fixture.
The key maintenance advantage of LED over HID is not that LEDs never fail — it's that they fail less frequently, their failures are less expensive when they do occur, and the absence of HID's predictable relamping events eliminates the large staircase maintenance cost spikes. See the integrated LED vs socketed lifespan data for the detailed driver failure timing analysis and the durable materials guide for fixture material choices that affect maintenance intervals in outdoor environments.
Worked Example: 20-Fixture Residential Landscape System Over 20 Years
A typical residential landscape lighting system with 20 low-voltage LED path lights and accent fixtures. Comparing: existing 20W halogen MR16 fixtures (non-dark-sky) vs new 4W dark sky compliant LED equivalent fixtures. Assumptions: 6 hours/night operating, $0.13/kWh base electricity rate, 2.5% energy escalation, 3% real discount rate.
| LCC Component | 20W Halogen ×20 Fixtures | 4W Dark Sky LED ×20 | LED Advantage (PV) |
|---|---|---|---|
| Initial fixtures + installation | $1,200 (existing) | $2,400 (20 × $120 installed) | −$1,200 initial |
| Annual energy: 20 fixtures × operating hours × wattage | $285/yr (20×20W × 2,190hrs × $0.13) | $57/yr (20×4W × 2,190hrs × $0.13) | $228/yr base savings |
| 20-yr PV energy cost (2.5% escalation, 3% discount) | $5,148 | $1,030 | $4,118 PV savings |
| Transformer upgrade (halogen = 400W needed; LED = 80W needed) | $350 (400W transformer) | $180 (150W transformer) | $170 PV savings |
| Halogen MR16 relamping: every 2 yrs × 10 events × $3/bulb × 20 fixtures | $600 undiscounted; ~$470 PV | $0 | $470 PV savings |
| LED driver replacement: yr 6 & yr 12 × $30/fixture × 20 fixtures | $0 | $600 × 2 events; ~$700 PV | −$700 PV cost |
| Annual lens cleaning / inspection | $150/yr; ~$2,240 PV | $60/yr; ~$896 PV | $1,344 PV savings |
| Disposal (halogen: standard waste; LED: standard) | ~$50 PV | ~$50 PV | Neutral |
| Total 20-Year LCC | ~$9,818 | ~$5,456 | $4,362 total savings |
The Dark Sky Premium Recovery Timing: In this residential example, the $1,200 initial premium for dark sky compliant LED fixtures is recovered from energy savings in approximately 5.3 years (simple payback: $1,200 ÷ $228/yr = 5.3 years). The LCCA discounted payback is slightly longer at approximately 6.2 years — but the 20-year total savings of $4,362 still represent a strong positive return. The dark sky compliance benefit here is not primarily financial — it's that the same system that produces the better financial return also eliminates all uplight from the 20-fixture installation and reduces the system's contribution to neighborhood light trespass. Full shielding is effectively free from an LCC perspective for this system type, because the lower-wattage compliant fixtures cost less to operate than the unshielded alternatives they replace.
Worked Example: 40-Fixture Commercial Property Over 20 Years
A commercial parking lot and perimeter lighting system with 40 fixtures. Comparing: existing 400W metal halide high-bay fixtures (non-dark-sky, dusk-to-dawn operation) vs new 150W dark sky compliant LED fixtures. Assumptions: 4,380 hours/year (dusk-to-dawn), $0.125/kWh base electricity rate, 2.5% energy escalation, 3.5% real discount rate.
| LCC Component | 400W Metal Halide ×40 | 150W Dark Sky LED ×40 | LED Advantage (PV) |
|---|---|---|---|
| Initial fixtures + installation (per fixture) | $0 (existing) | $80,000 (40 × $2,000) | −$80,000 initial |
| Annual energy: 460W actual (400W + 15% ballast) vs 150W | $25,231/yr (40×460W×4,380×$0.125÷1000) | $8,213/yr (40×150W×4,380×$0.125÷1000) | $17,018/yr base savings |
| 20-yr PV energy cost (2.5% escalation, 3.5% discount) | $359,220 | $116,970 | $242,250 PV savings |
| Relamping: yr 2, 4, 6, 8, 10, 12, 14, 16, 18 × $120/fixture × 40 | $216,000 undiscounted; ~$143,000 PV | $0 | $143,000 PV savings |
| Ballast replacement: yr 6 & yr 13 × $300/fixture × 40 | $24,000 × 2; ~$24,500 PV | $0 | $24,500 PV savings |
| LED driver replacement: yr 6 & yr 12 × $100/fixture × 40 | $0 | $4,000 × 2 events; ~$5,100 PV | −$5,100 PV cost |
| Lamp disposal (HID = hazardous waste, $15/lamp; LED = standard) | 9 events × 40 × $15 = $5,400; ~$4,200 PV | $0 | $4,200 PV savings |
| Ordinance non-compliance retrofit risk (see hidden costs) | $0–$120,000 contingent exposure | $0 | Risk eliminated |
| Annual OM&R (cleaning, inspection, minor repairs) | $4,000/yr; ~$55,000 PV | $1,200/yr; ~$16,500 PV | $38,500 PV savings |
| Total 20-Year LCC (excluding ordinance risk) | ~$545,920 | ~$218,570 | $327,350 total PV savings |
In this commercial example, the $80,000 LED installation investment is recovered from maintenance and energy savings in approximately 4.7 years — substantially earlier than the simple payback calculation suggests because the heavy relamping and ballast replacement costs in the early years of the HID system produce disproportionately large present-value savings at the front end of the study period. Over 20 years, the dark sky compliant LED system costs $327,350 less in present-value terms — more than four times the initial investment premium.
The Dark Sky Fixture Premium: What It Actually Costs and When It Pays Back
The most common objection to dark sky compliant fixtures is their price premium. This section documents what that premium actually is, where it comes from, and when LCC analysis shows it pays back.
What the Premium Actually Consists Of
The IDA Fixture Seal of Approval program certifies fixtures — it doesn't add a certification fee to the fixture cost. The price premium for dark sky approved vs standard LED fixtures from the same manufacturer is typically 10–25%, driven by:
- Full cutoff optics: Precision optical design that directs 100% of lumen output below the horizontal costs more than standard non-cutoff optical assemblies. The optical housing, reflector geometry, and lens design are more complex.
- 3000K and below LED arrays: Warm CCT LED arrays (2700K–3000K) were historically more expensive per lumen than 4000K–5000K arrays because warm LEDs require different phosphor chemistry. This gap has narrowed significantly — in current product, the cost premium for 3000K vs 4000K LED is typically less than 5%.
- No uplight panels or drop lenses: IDA approval requires eliminating certain optical elements — so in some cases, the dark sky version is actually simpler and less expensive to manufacture than the standard version.
- IDA application fee: Manufacturers pay a fee to submit products for IDA review. This is typically amortized across the product line and adds negligible per-unit cost.
The Wattage Reduction Benefit — The Core LCC Advantage
The efficiency mechanism that often makes dark sky compliant fixtures cost-neutral or favorable in LCC is the wattage reduction that comes from full-cutoff optics. An unshielded fixture may need 250W of LED output to achieve 2 footcandles average in a parking area, because 30–40% of its light is wasted upward and sideways. A full-cutoff fixture directing 100% downward can achieve the same 2 footcandles with 150–180W. The 70–100W difference per fixture is operating continuously for dusk-to-dawn. At 4,380 hours annually and $0.125/kWh, that's $38.33–$54.75 per fixture per year in direct energy savings from shielding alone — independent of the LED vs HID comparison.
Per the McDonald Observatory's Dark Skies Initiative, as documented by VOLT Lighting: "We can reclaim vast amounts of energy currently wasted inadvertently into the night sky by using light fixtures that are shielded to reflect light down where it is needed, as well as using the smallest number of lights and lowest wattage bulbs necessary." This energy reclamation from shielding is the LCC advantage that makes dark sky compliant fixtures financially competitive even before considering compliance risk avoidance. See the dark sky compliance vs IDA certification guide for the full fixture selection framework and BUG ratings guide for the photometric performance specification.
Payback Timeline for the Dark Sky Premium
| Scenario | Dark Sky Premium | Annual Wattage Savings/Fixture | Simple Payback | LCC Payback |
|---|---|---|---|---|
| Low-voltage landscape: 10W standard vs 6W dark sky | $15/fixture (12%) | 4W × 2,190hr × $0.13 = $1.14/yr | 13 yrs | 16 yrs |
| Pathway / step lights: 5W standard vs 3W dark sky | $20/fixture (18%) | 2W × 2,190hr × $0.13 = $0.57/yr | 35 yrs | Not from energy alone — compliance value drives decision |
| Commercial area light: 200W standard vs 150W dark sky | $400/fixture (22%) | 50W × 4,380hr × $0.125 = $27.38/yr | 14.6 yrs | 18 yrs (but compliance risk avoidance accelerates decision) |
| MH to dark sky LED retrofit: 460W effective vs 150W | −$200/fixture (premium vs new LED) | 310W × 4,380hr × $0.125 = $169.80/yr | 2.1 yrs vs MH | 2.5 yrs vs MH (best case) |
Five Hidden Costs Most Outdoor LCCs Omit
Standard outdoor lighting LCC analyses typically include initial cost, energy cost, and lamp replacement. These five costs are almost always missing — and for dark sky compliance decisions, several of them significantly affect the result.
At least 19 states have dark sky or outdoor lighting laws, and hundreds of municipalities have adopted lighting ordinances. A commercial property installing non-compliant outdoor lighting today faces a probability-weighted contingent cost: if the jurisdiction adopts or enforces a dark sky ordinance during the 20-year study period, the property must retrofit all non-compliant fixtures.
A commercial installation of 40 non-compliant fixtures that must be replaced due to ordinance adoption faces $40,000–$80,000 in retrofit costs that were not in the original LCC. Even at a 20% probability of this occurring during the study period, the expected-value cost is $8,000–$16,000 per installation — which is the correct O component value to add to the non-dark-sky alternative's LCC. See the ordinance guide for jurisdictional trends.
Non-dark-sky-compliant fixtures with significant horizontal and upward light emission create light trespass onto adjacent properties. Per the light trespass laws guide on this site, documented cases include lawsuits and municipal citation fines for commercial properties. Light trespass liability exposure is difficult to quantify precisely but belongs in the O cost component as a contingent liability.
Beyond legal liability, light trespass causes real neighbor friction that may require fixture replacement, additional shielding ($50–$150 per fixture in aftermarket shields), or legal representation. A fully shielded dark sky compliant installation eliminates this exposure entirely. See the light trespass laws guide and liability claims database.
LCC models for HID systems often assume clean relamping events at the rated lamp life interval. Real HID maintenance has a more expensive profile: ballasts fail independently of lamps, often mid-cycle, requiring both a lamp and ballast to be replaced simultaneously even if the lamp still had remaining life. Per Hyperlite: replacing a ballast "often costs 60% of the price of a brand-new LED fixture in labor alone."
A 20-year LCC that models only lamp replacement costs — without ballast replacement as a separate event — understates HID maintenance costs by $300–$500 per fixture over the study period (two ballast replacement events at $150–$250 each in present-value terms). For 40 fixtures, this is a $12,000–$20,000 understatement.
HPS lamps contain mercury and must be disposed of as hazardous waste under EPA regulations. Metal halide lamps also contain mercury and are subject to the same requirements. Per the greenhouse lighting LCC research documented in the archived studies: "Disposal Fees: HPS (classified as hazardous waste) = 9 bulbs = $18 USD" — a modest per-event cost that compounds over 20 years of repeated relamping cycles.
For a 40-fixture commercial MH installation with 9 relamping events over 20 years: 9 events × 40 fixtures = 360 lamp disposals. At $2–$5 per lamp for certified hazardous lamp recycling programs, that's $720–$1,800 in disposal costs over 20 years that typically appears nowhere in simple payback analysis. LED fixtures produce no hazardous lamp waste.
High-wattage HID landscape lighting systems require more robust transformers, heavier-gauge wire runs, and more careful voltage drop management than LED replacements. A 40-fixture HID system drawing 460W per fixture totals 18,400W — a very large transformer and heavy-gauge runs throughout the site. An LED system at 150W per fixture totals only 6,000W, potentially allowing use of a significantly smaller transformer and standard wire gauge throughout.
Transformer cost difference (18,400W vs 6,000W transformer capacity): often $2,000–$5,000 for the transformer hardware alone, plus installation cost differences. Over a 20-year period with one transformer replacement, this cost difference appears twice. Additionally, heavier-gauge wire has a real cost advantage for the LED system — the initial installation wiring cost for a new LED system is lower per linear foot because the wire gauge can be reduced for the lower amperage draw. See the wire gauge ampacity database for the specific gauge reductions possible at lower wattages, and the voltage drop energy waste guide for the energy cost implications of oversized wiring runs.
Sensitivity Analysis: Which Variable Drives the LCC Answer
A complete LCC analysis is only as reliable as its input assumptions. Sensitivity analysis tests how much the total LCC changes when each input is varied by a fixed percentage — revealing which assumptions matter most and which the decision is relatively insensitive to.
For a 40-fixture commercial MH-to-dark-sky-LED conversion over 20 years, varying each input by ±20% from the base case and measuring the impact on total LCC difference (LED advantage):
The Counterintuitive Finding: The fixture price premium — the number most people focus on when comparing dark sky compliant vs standard outdoor fixtures — has the smallest impact on the 20-year LCC result. A 20% increase in the fixture premium changes the outcome by only about 3%. Meanwhile, a 20% change in the energy escalation rate assumption changes the outcome by 15%. When presenting an LCC to a client or board, spend time on the energy escalation assumption (and show three scenarios), and spend less time defending the fixture price difference.
The Three-Scenario Presentation Approach
Because energy escalation rate dominates the sensitivity, any credible outdoor lighting LCC should present three scenarios: a conservative case (0% energy escalation, equivalent to constant real electricity prices), a base case (2–2.5% escalation based on EIA long-run forecasts), and an elevated case (4% escalation, plausible in high-demand or renewable-transition scenarios). Presenting these three scenarios — rather than a single LCC number — shows decision-makers that the LED investment is favorable across all reasonable assumptions about future energy prices, not just the most optimistic scenario. For residential landscape systems, the landscape lighting energy calculator provides the base energy cost inputs for your specific system.
Disposal Costs: The HID Hazardous Waste Problem in LCC
Mercury Content and Regulatory Classification
High-pressure sodium (HPS) and metal halide (MH) lamps contain mercury — a hazardous material under EPA regulations. Spent HPS and MH lamps cannot legally be disposed of as general solid waste in most US jurisdictions. The Universal Waste Rule (40 CFR Part 273) provides a simplified compliance pathway for lamp disposal — lamps must be labeled, stored in closed containers, and sent to certified lamp recyclers — but this compliance path has real costs that belong in the LCC.
Typical lamp disposal costs through certified recycling programs: $1–$5 per lamp for standard HPS/MH lamps, with minimum shipment fees that push the effective per-lamp cost higher for small quantities. For a 40-fixture commercial installation replacing lamps every 2 years (9 relamping events over 18 years): 9 × 40 = 360 spent lamps. At $3/lamp average disposal cost: $1,080 in disposal costs over 20 years that belongs in the O cost component. At a 3.5% discount rate, the present value of this stream is approximately $820 — not enormous, but entirely absent from most simple payback analyses.
LED Disposal — No Hazardous Material Concern
LED fixtures do not contain mercury and are not classified as hazardous waste in the US under current regulations. LED fixture disposal follows standard electronic waste protocols — many municipalities have e-waste drop-off programs and some manufacturers offer take-back programs. The practical disposal cost for LED fixtures in the LCC is effectively zero or minimal compared to HID lamp disposal costs.
The exception: some LED fixtures contain small quantities of regulated materials in printed circuit boards. For large commercial LED installations (500+ fixtures), it's worth checking whether local e-waste regulations apply and factoring a small per-fixture disposal cost into the O component at end of study period.
Utility Rebates and Section 179D: How They Enter the LCC
Utility Rebate Programs
Many utility companies offer rebates for commercial LED lighting upgrades — typically $0.10–$0.50 per reduced watt for commercial retrofits. For a 40-fixture MH-to-LED conversion reducing load by 310W per fixture (460W to 150W): 40 fixtures × 310W × $0.20/watt = $2,480 in rebates. This rebate reduces the effective initial investment cost (I in the LCC formula). Per Luminategroup's documented LCC analysis: "Businesses also benefit from utility rebates and federal tax deductions like Section 179D, which further reduce costs." Utility rebates should be subtracted from the I component in the base case, reducing the payback period. Per the documented example: "replacing 20 metal halide lamps with LEDs can save $3,877 yearly, with a payback period of just 9 months" when rebates are included — though this represents an optimistic commercial case.
Section 179D Commercial Building Tax Deduction
Section 179D of the Internal Revenue Code provides a tax deduction for energy-efficient commercial building improvements including lighting. The deduction amount for lighting upgrades was increased by the Inflation Reduction Act of 2022, and the specific qualified deduction amount should be verified with a tax professional for any project. In LCC terms, the Section 179D deduction reduces the after-tax cost of the LED installation — which reduces the effective I in the formula. For a commercial LCC presentation to a property owner, include a separate line showing the Section 179D deduction impact on the effective investment cost and resulting payback period.
Dark Sky Compliance-Specific Incentives
Some municipalities that have adopted dark sky ordinances also offer incentive programs for early compliance — either rebates for compliant fixture installation, waived permit fees for dark sky retrofits, or property tax adjustments. These programs are not universal but worth checking with the local AHJ or municipal energy office before finalizing an LCC for a dark sky compliance retrofit. The dark sky compliance guide covers jurisdictional adoption trends and resources for identifying local programs.
Lighting Life Cycle Cost Analysis FAQ
What is a lighting life cycle cost analysis and how does it differ from simple payback?
A lighting life cycle cost analysis (LCCA) calculates the total present-value cost of a lighting system over its full service life — including initial purchase, energy consumption, maintenance, lamp and driver replacements, and disposal — all discounted to today's dollars using a real discount rate. Simple payback divides the net project cost by annual savings to find the break-even year. Research published in HortTechnology journal found that simple payback predicted payback 3 years earlier than LCCA for LED vs HPS comparisons, and in some cases LCCA showed the project would not pay back within the building's lifespan even when simple payback claimed it would. For significant outdoor lighting investments — especially dark sky compliance retrofits — LCCA provides a more accurate basis for decisions. See the simple payback vs LCCA section.
How much money is wasted annually by non-dark-sky-compliant outdoor lighting?
IDA (now DarkSky International) estimates that at least 30% of all outdoor lighting in the US is wasted — primarily because fixtures aren't properly shielded — amounting to approximately $3.3 billion in wasted energy annually and 21 million tons of CO2. For individual property LCC calculations, this translates to a 30–40% wattage efficiency gap: an unshielded fixture requires more wattage than a full-cutoff fixture delivering the same useful ground-level footcandle level, because unshielded light directed skyward and sideways is wasted energy. The full-cutoff fixture premium of 10–25% is typically offset within 3–5 years by energy savings from the lower wattage requirement. See the dark sky premium analysis section and the dark sky compliance guide.
What is the WBDG LCC formula and what does each component include for outdoor lighting?
The Whole Building Design Guide LCC formula is: LCC = I + Repl − Res + E + OM&R + O, where all values are in present-value dollars. I = initial investment (fixtures, installation, transformer, controls); Repl = future capital replacements (driver replacements, major component replacements); Res = residual value (salvage at end of study period less disposal costs); E = present value of energy costs (electricity consumed, escalated and discounted over the study period); OM&R = present value of maintenance costs (lamp cleaning, inspections, relamping for HID, spot repairs); O = other costs (compliance costs, disposal fees for hazardous lamps, permit costs). For outdoor landscape lighting, the E and OM&R components dominate — energy costs represent 60–80% of the 20-year LCC for HID systems. See the complete LCC formula section.
Which input assumption changes the LCC result the most?
Energy escalation rate — not fixture price, not discount rate, not even base electricity rate. Sensitivity analysis for a 40-fixture commercial conversion shows that a 20% change in energy escalation rate changes the 20-year LCC difference by 15%, while a 20% change in fixture initial cost premium changes it by only 3%. This means: (1) When presenting an LCC, always show three energy escalation scenarios (conservative / base / elevated) rather than a single number; (2) Spend more time validating the energy escalation assumption than defending the fixture price; (3) The most common LCC objection — "these fixtures cost too much" — is actually the assumption that matters least over a 20-year period. See the full sensitivity analysis section.
Related Dark Sky Compliance & Sustainability Guides
- Dark Sky Compliance Guide
- Dark Sky Fixture Selection
- Landscape Lighting Carbon Footprint
- Landscape Lighting Energy Calculator
- Outdoor Lighting Ordinance Guide
- BUG Ratings Guide
- Smart Outdoor Lighting Controls
- Durable Materials Guide
- Solar vs Low Voltage Efficiency
- Color Temperature Guide
- Outdoor Lighting and Human Health
- Biological Impact of Light Color
- Wildlife-Friendly Outdoor Lighting
- Fix Light Trespass
- Lumen vs Light Pollution
- Minimizing Voltage Drop Energy Waste
- Light Trespass Laws
- Landscape Lighting Costs
- Integrated LED vs Socketed Lifespan
- Wire Gauge Ampacity Database
- Commercial Upgrade Safety ROI
- Code Enforcement Cases
- Landscape Lighting Guide