
⚡ Landscape Lighting Energy Calculator
Add each fixture type in your system. The calculator gives you annual kWh, electricity cost, and CO2 emissions — plus LED equivalent savings if you are running halogen or incandescent.
🌿 Your Landscape Lighting Energy Profile
🌿 Switching to LED Would Save
Your system is already fully LED — great work. Use the payback calculator below to model future fixture upgrades.
📈 LED Upgrade Payback Period Calculator
This calculator tells you exactly how many years it takes for LED landscape fixtures to pay for themselves through electricity savings compared to halogen — accounting for fixture cost premium, annual operating savings, and maintenance cost avoidance from longer LED lifespan.
Fixture Wattage Benchmarks: What to Enter in the Calculator
The accuracy of the calculator depends on entering the correct wattage for your specific fixtures. This table provides the real-world wattage ranges for every major landscape lighting fixture type and lamp technology — these are measured draw figures, not nominal or marketing ratings. Use these as defaults if you do not know your specific fixture wattage. For confirmed wattage, check the label inside the fixture housing or the original packaging.
Electrical consumption is only one part of outdoor-lighting efficiency. A climate-inappropriate fixture may consume little energy but still create high replacement costs and unnecessary waste when heat destroys its driver, salt corrodes the housing, or moisture damages the connectors. After calculating operating power, review the Outdoor Lighting Climate Performance Guide to estimate which components are most vulnerable in your location and what material or maintenance changes could extend the life of the system.
| Fixture Type | Lamp Technology | Typical Wattage Range | Lumens Output | Lm/W Efficiency | Rating |
|---|---|---|---|---|---|
| Path light | LED (current gen) | 2–5W | 150–400 lm | 75–120 lm/W | Best |
| Path light | Halogen (G4/MR11) | 10–20W | 150–300 lm | 15–20 lm/W | Poor |
| Path light | Incandescent (T3/wedge) | 7–11W | 70–150 lm | 10–14 lm/W | Poor |
| Spotlight / bullet | LED (current gen) | 3–8W | 300–800 lm | 80–120 lm/W | Best |
| Spotlight / bullet | Halogen (MR16/PAR36) | 20–50W | 300–700 lm | 15–18 lm/W | Poor |
| Well light (in-ground) | LED (current gen) | 5–12W | 400–1000 lm | 70–100 lm/W | Best |
| Well light (in-ground) | Halogen (PAR36) | 35–50W | 400–700 lm | 12–16 lm/W | Poor |
| Flood / area light | LED (current gen) | 10–20W | 800–2000 lm | 80–110 lm/W | Best |
| Flood / area light | Halogen (PAR38) | 75–150W | 800–1800 lm | 12–15 lm/W | Poor |
| Step / deck light | LED (current gen) | 1–3W | 60–200 lm | 60–100 lm/W | Best |
| Step / deck light | Halogen | 10–20W | 100–250 lm | 10–15 lm/W | Poor |
| Wall washer | LED (current gen) | 6–15W | 500–1200 lm | 75–100 lm/W | Best |
| String / festoon | LED (filament style) | 0.5–2W per bulb | 30–120 lm/bulb | 50–80 lm/W | Good |
| Solar path light | LED + solar panel | 0.1–0.5W (panel) | 10–80 lm | N/A (solar) | Zero cost |
For the lumen output needed for specific landscape lighting applications — path lighting, tree uplighting, or step illumination — see the landscape lighting lumen guide which covers the minimum and recommended footcandle levels for every application type. For understanding how lumen-per-watt efficiency interacts with beam spread and the actual light delivered to a surface, see the beam spread guide.
Energy savings are only one part of the LED upgrade decision. Two fixtures can use similar wattage but have very different long-term costs if one requires repeated bulb replacements and the other is designed as a sealed integrated LED unit. After calculating annual energy use, review the integrated LED vs. socketed lifespan data to compare energy savings against maintenance frequency, replacement cycles, and fixture service life.
Annual energy costs provide an important starting point, but they represent only part of the financial picture. Fixture replacement, maintenance visits, driver failures, battery replacements, and system upgrades often exceed electricity costs over the lifespan of an outdoor lighting installation. After estimating energy usage, review our lighting life-cycle cost analysis guide to understand the full long-term cost of ownership associated with different lighting technologies.
CO2 Emissions From Landscape Lighting: The Real Math
The CO2 emissions from your landscape lighting are not a fixed number — they depend on how the electricity powering your system was generated. The same 100 kWh of electricity produces 20 kg of CO2 in the Pacific Northwest (mostly hydropower) and 48 kg in the coal-heavy Southeast. Understanding the grid emissions factor for your region makes the CO2 calculation meaningful rather than generic.
How the CO2 Calculation Works
The formula is: Annual kWh × Grid CO2 factor (kg/kWh) = Annual CO2 emissions (kg). The grid CO2 factor reflects the weighted average emissions intensity of your regional electricity grid — how many kilograms of CO2 are emitted per kilowatt-hour of electricity generated across all power sources on that grid. The US national average is 0.386 kg CO2 per kWh based on the EPA's eGRID database. Your specific utility may publish its own emissions factor on its website or annual sustainability report.
| Grid Region | CO2 Factor (kg/kWh) | Primary Source Mix | 12-fixture LED system CO2/yr | 12-fixture Halogen system CO2/yr |
|---|---|---|---|---|
| Pacific Northwest (NWPP) | 0.200 | Hydro dominant | 21 kg | 105 kg |
| California (CAISO) | 0.310 | Gas + solar mix | 33 kg | 163 kg |
| US National Average | 0.386 | Gas + coal + nuclear | 41 kg | 203 kg |
| Mid-Atlantic (PJM) | 0.420 | Gas + nuclear + coal | 44 kg | 221 kg |
| Midwest (MROW) | 0.450 | Coal + wind mix | 47 kg | 237 kg |
| Southeast (SRSO) | 0.480 | Coal + gas dominant | 50 kg | 253 kg |
The CO2 equivalence comparisons that make these numbers tangible: 1 kg of CO2 is emitted driving approximately 2.5 miles in a typical passenger car (EPA: 0.404 kg CO2/mile). 203 kg of annual CO2 from a 12-fixture halogen landscape system equals approximately 500 miles driven. Switching to LED saves 162 kg per year — the equivalent of not driving 400 miles. A 20-fixture halogen system produces 338 kg annually — roughly 840 miles of driving. These are meaningful quantities, not rounding errors. The energy reduction from landscape lighting LED conversion is genuinely comparable to measurable vehicle emission reductions.
For the broader context on how outdoor lighting color temperature interacts with biological impact beyond pure energy consumption, see the biological impact of outdoor light color guide. For voltage drop's effect on actual energy efficiency in installed systems — a factor the calculator does not account for — see the minimizing voltage drop energy waste guide. Voltage drop can increase effective system wattage by 5 to 15% above the fixture nameplate rating.
Full Efficiency Comparison: LED vs Halogen vs Incandescent vs Solar
This table provides the complete comparison across all four landscape lighting technologies across every dimension that affects energy consumption and operating cost. The lumen-per-watt column is the most important single efficiency metric — it tells you how much light you get per watt consumed, independent of the absolute wattage of any individual fixture.
| Technology | Typical lm/W | Typical path light wattage | Annual kWh (12 fixtures, 6h/night) | Annual cost (US avg rate) | Lifespan (hours) | Maintenance cycles/10yr |
|---|---|---|---|---|---|---|
| LED (current gen, high quality) | 80–120 | 3–5W | 79–131 kWh | $9–$16 | 25,000–50,000 | 0–1 bulb changes |
| LED (budget / entry level) | 50–75 | 5–8W | 131–210 kWh | $16–$25 | 15,000–25,000 | 1–2 bulb changes |
| Halogen (MR11/G4) | 15–20 | 10–20W | 263–526 kWh | $32–$63 | 1,500–2,500 | 6–10 bulb changes |
| Incandescent (T3/wedge base) | 10–14 | 7–11W | 184–289 kWh | $22–$35 | 750–1,500 | 10–20 bulb changes |
| Solar LED (good quality) | N/A (solar) | 0.1–0.5W panel equiv. | 0 kWh (grid) | $0 electricity | LED: 15,000–25,000; panel: 5–8 years | Panel replacement at 5–8yr |
| CFL (compact fluorescent) | 40–70 | 5–9W | 131–236 kWh | $16–$28 | 6,000–10,000 | 3–6 bulb changes |
The Maintenance Cost Factor Most Calculators Miss
The wattage comparison alone understates the total cost difference between halogen and LED landscape lighting because it ignores bulb replacement frequency and labor. A halogen landscape fixture typically needs bulb replacement every 1,500 to 2,500 hours — which at 6 hours per night means a new bulb every 9 to 14 months. LED fixtures last 25,000 to 50,000 hours — 11 to 23 years at the same usage rate. For a 12-fixture system over 10 years, halogen requires 8 to 14 bulb change events while LED requires zero or one. If each bulb change costs $3 to $8 in materials plus 5 minutes of labor per fixture, the maintenance cost difference over 10 years is $360 to $1,000 for a 12-fixture system — often exceeding the electricity savings alone.
The solar vs low-voltage energy efficiency comparison covers the full economic comparison between solar landscape lighting and low-voltage LED systems including the solar panel replacement cost that solar-only calculators typically omit. The durable landscape lighting materials guide covers how fixture material quality affects maintenance frequency — a factor that multiplies across your total fixture count.
Operating Hours: The Variable That Matters More Than Fixture Wattage
The single most powerful variable in landscape lighting energy consumption is not which fixture technology you use — it is how many hours per night the system runs. This is why timer and photocell control is one of the highest-return investments in landscape lighting energy efficiency, often saving more energy than the fixture technology switch alone.
The Hours-Per-Night Energy Impact
A 12-fixture LED system at 4 watts per fixture running 10 hours per night consumes 175 kWh annually. The same system running 4 hours per night consumes 70 kWh — a 60% reduction in consumption with zero change to the fixtures themselves. For a halogen system the impact is proportionally larger: 10 hours consumes 876 kWh; 4 hours consumes 350 kWh — saving 526 kWh annually, worth $63 at average US rates, purely from reducing operating hours.
Dusk-to-Dawn vs Timer vs Smart Controls: Energy Comparison
| Control Strategy | Typical Operating Hours/Night | Annual kWh (12×4W LED) | Annual Cost (US avg) | Annual CO2 (US avg grid) |
|---|---|---|---|---|
| No timer — always on at night | 10–14 hrs | 175–245 kWh | $21–$29 | 68–95 kg |
| Photocell only (dusk-to-dawn) | 8–12 hrs (seasonal) | 140–210 kWh | $17–$25 | 54–81 kg |
| Timer: dusk to midnight | 4–6 hrs | 70–105 kWh | $8–$13 | 27–41 kg |
| Timer: dusk +2hr then off; pre-dawn 1hr | 3 hrs total | 53 kWh | $6 | 20 kg |
| Smart controls with occupancy sensing | 1–3 hrs effective | 18–53 kWh | $2–$6 | 7–20 kg |
The landscape lighting timer settings guide covers the specific programming approaches for maximizing energy efficiency while maintaining the security and aesthetic benefits of landscape lighting. The Portfolio low-voltage timer guide covers timer programming for Portfolio transformer models specifically. For smart control integration that takes operating hour reduction further through occupancy sensing and daylight harvesting, see the smart outdoor lighting controls guide.
In 25 years of landscape lighting installation and maintenance, I have found that the majority of residential systems I service are running 3 to 5 hours more per night than the homeowner intends or desires. A photocell set to dusk-to-dawn with no timer runs the system until 5 or 6 AM in winter — often 12 hours total — when the homeowner thinks it shuts off at midnight. The first and easiest energy reduction step for most existing systems is simply to add a timer cutoff. At $0 fixture cost, this typically reduces consumption by 30 to 50% immediately.
How to Reduce Landscape Lighting Energy Consumption Without Sacrificing Light Quality
The five interventions below are ranked by their typical energy reduction impact, from highest to lowest. They are also ranked roughly by cost — the first two cost nothing to implement on an existing system. The combination of all five in a typical residential halogen or mixed-technology system typically reduces consumption by 75 to 90% compared to an unoptimized dusk-to-dawn halogen baseline.
1. Add a Timer Cutoff to an Existing Photocell (Zero Cost)
If your transformer has a photocell but no timer, adding a timer to shut the system off at a fixed time — typically midnight or 1 AM — prevents the system from running all night during winter months when darkness lasts 14 to 16 hours. This single change reduces operating hours by 4 to 8 hours per night in winter, cutting annual consumption by 20 to 35% on a photocell-only system. The timer settings guide covers optimal schedules for security, aesthetics, and energy conservation.
2. Replace Halogen Fixtures With LED (Medium Cost — Highest Long-Term Return)
Replacing halogen landscape fixtures with equivalent LED fixtures reduces per-fixture energy consumption by 75 to 85% while delivering equal or better lumen output. For a 12-fixture halogen system at 20 watts each, the electricity saving is approximately $50 per year at US average rates — plus $30 to $80 per year in bulb replacement cost avoidance. The payback calculator above gives the precise timeline for your specific fixture inventory and electricity rate. The lumen guide helps match LED output to the original halogen lumen level without over-lighting.
3. Reduce Fixture Count by Eliminating Over-Lit Zones
Most residential landscape lighting systems installed before 2015 were designed for halogen fixtures and specified fixture counts based on the lower lumen output of those fixtures. Converting those fixtures to LED — which produces 4 to 8 times more lumens per watt — often results in over-lit areas. Removing 20 to 30% of fixtures from a converted system returns the illumination to the original intended levels while reducing consumption proportionally. Removing 3 fixtures from a 12-fixture system reduces consumption by 25% with no other change.
4. Correct Voltage Drop to Eliminate Phantom Energy Waste
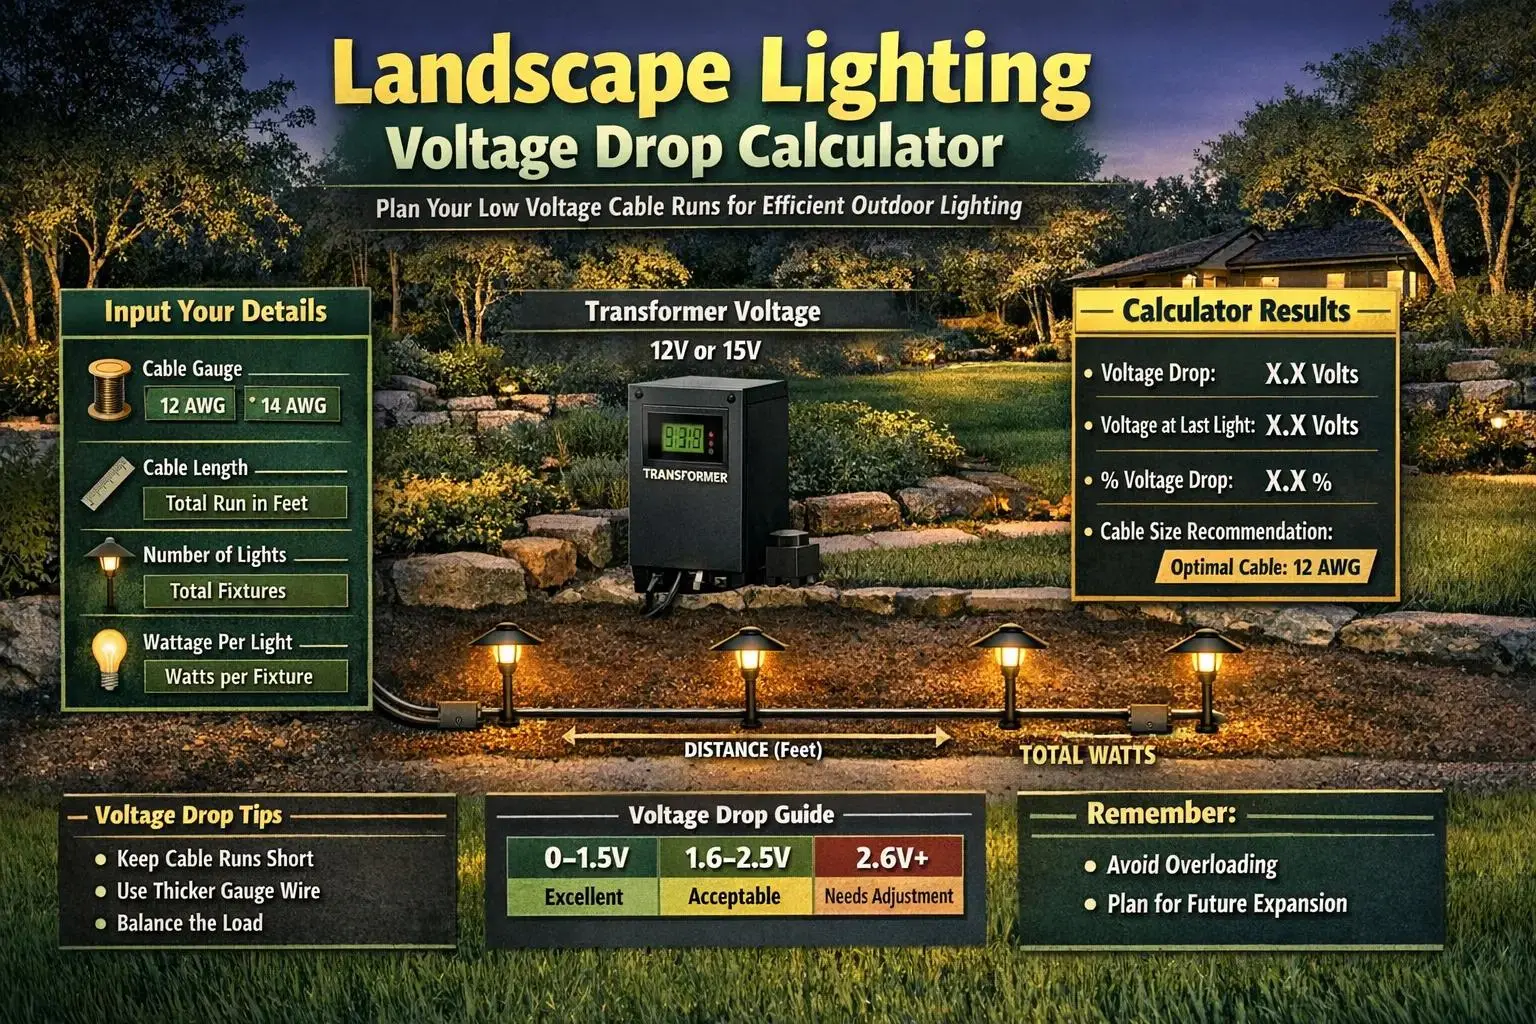
Voltage drop in long landscape lighting wire runs causes transformers to work harder than necessary and causes LED drivers to draw inefficiently. A system with significant voltage drop may be consuming 10 to 15% more energy than the fixture nameplate ratings suggest — a hidden waste that the nameplate-based energy calculator cannot capture. The voltage drop guide, the voltage drop calculator, and the minimizing voltage drop energy waste guide cover the measurement and correction of voltage drop in existing systems.
5. Upgrade to Smart Controls With Occupancy Sensing
Smart landscape lighting controls that use occupancy sensing, astronomical timers, and adaptive dimming can reduce operating hours to as little as 1 to 2 effective full-brightness hours per night by dimming to 20% during periods of no activity and brightening to full output only when movement is detected. This represents the highest energy reduction of any single intervention but also the highest upfront cost. The smart outdoor lighting controls guide covers the specific products and installation approaches for adding smart control to existing low-voltage landscape lighting systems.
Landscape Lighting Energy FAQ
How much electricity does landscape lighting use per year?
A typical 12-fixture LED landscape system at 4 watts per fixture running 6 hours per night consumes approximately 105 kWh per year — about $13 at the US average electricity rate. The same fixture count in halogen at 20 watts each consumes 526 kWh per year — about $63. Use the calculator on this page to get the precise figure for your specific fixture count, wattage, hours, and electricity rate.
How much CO2 does landscape lighting produce per year?
At the US national average grid emissions factor of 0.386 kg CO2 per kWh, a 12-fixture halogen landscape system running 6 hours per night produces approximately 203 kg of CO2 annually — equivalent to driving a typical car about 500 miles. The same system in LED produces approximately 41 kg CO2 per year. Your actual figure depends on your regional grid's energy mix — use the calculator above and select your grid region for a location-specific result.
How long does LED landscape lighting take to pay for itself?
Assuming a $15 cost premium per LED fixture over halogen, a 12-fixture upgrade costs $180 in fixture premium. Annual electricity savings are approximately $50 at US average rates, plus $30 to $80 annually in bulb replacement cost avoidance. Combined saving: $80 to $130 per year. Payback period: 1.4 to 2.3 years. After payback, the LED system saves $80 to $130 per year indefinitely. Use the payback calculator above with your specific numbers.
Does voltage drop affect my landscape lighting energy consumption?
Yes — voltage drop in long wire runs causes LED drivers to operate inefficiently and can increase actual energy draw by 5 to 15% above the fixture nameplate rating. A system with significant voltage drop on a 100-foot wire run may consume materially more than the calculator estimates from nameplate wattages alone. The minimizing voltage drop energy waste guide covers the measurement and correction of voltage drop. The voltage drop calculator quantifies the voltage loss for your specific run length, wire gauge, and load.
What is the most energy-efficient landscape lighting option?
High-quality LED fixtures on a low-voltage transformer system with timer and photocell control — operated for 4 to 6 hours per night rather than dusk-to-dawn. This combination produces 80 to 120 lumens per watt (versus 15 to 20 for halogen), dramatically reduces operating hours, and eliminates the standby losses of inefficient older magnetic-core transformers. Solar landscape lighting has zero ongoing electricity cost but delivers lower and less consistent output and depends on daily sunlight. For the detailed comparison see the solar vs low-voltage energy efficiency guide.
How do I find my electricity rate for the calculator?
Your electricity rate in dollars per kilowatt-hour ($/kWh) appears on your monthly electricity bill — look for the line item labeled "energy charge," "usage rate," or simply "rate." The US national average is approximately $0.12/kWh as of 2026, but rates range from $0.08/kWh in Louisiana to $0.30+/kWh in Hawaii and parts of California. Using your actual rate rather than the national average makes the cost and payback calculations significantly more accurate for your specific situation.
Related Energy, Efficiency, and Sustainable Lighting Guides
- Solar vs Low-Voltage Energy Efficiency
- Minimizing Voltage Drop Energy Waste
- Smart Outdoor Lighting Controls Guide
- Biological Impact of Outdoor Light Color
- Durable Landscape Lighting Materials
- Dark Sky Compliance Guide
- Landscape Lighting Color Temperature
- Understanding BUG Ratings
- Outdoor Lighting Ordinance Guide
- Landscape Lighting Lumen Guide
- Landscape Lighting Beam Spread Guide
- Color Temperature Guide
- Voltage Drop Guide
- Voltage Drop Calculator
- Timer Settings for Energy Efficiency
- Portfolio Low-Voltage Timer Guide
- Landscape Lighting Transformer Guide
- Transformer Sizing Guide
- Circadian Landscape Lighting Guide
- Landscape Lighting Design Guide
- Landscape Lighting Maintenance Guide
- Landscape Lighting Cost Guide
- Transformer Size Calculator
- LED Lifespan L70 Database