
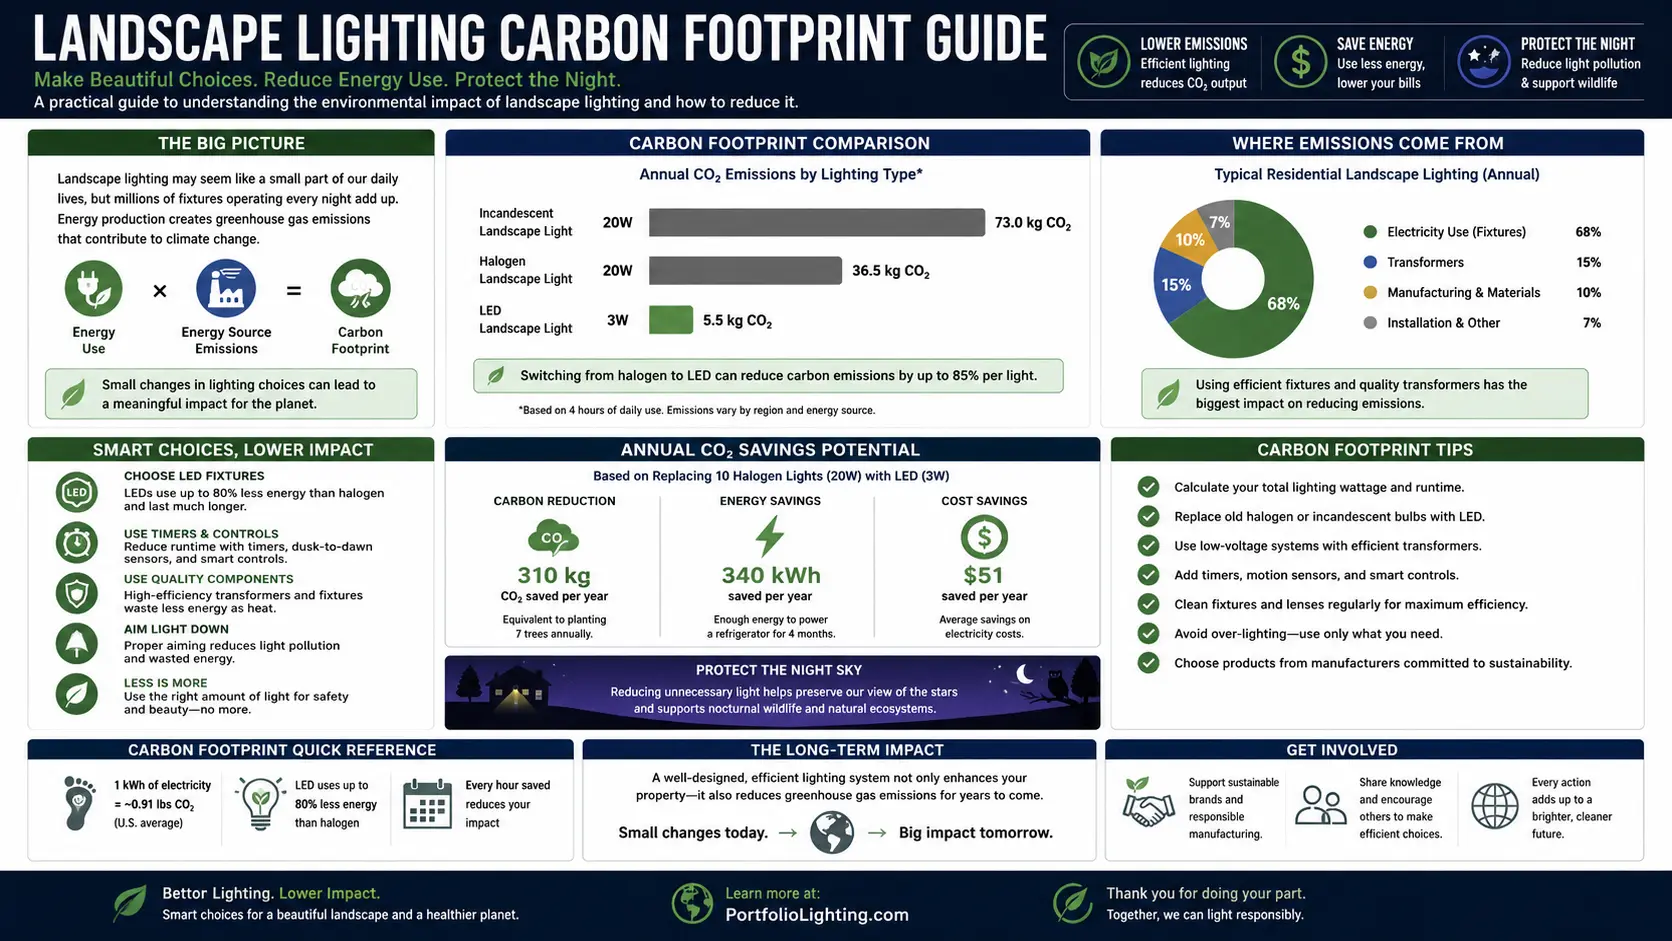
Why Landscape Lighting Carbon Footprint Is Worth Calculating
Landscape lighting is one of the few residential energy loads that runs every single night of the year on a predictable schedule — dusk to midnight or dusk to dawn, 365 days, rain or shine. Unlike appliances that cycle on and off based on use, your landscape lights run their full programmed hours whether anyone is enjoying them or not. That consistency makes their carbon footprint easy to calculate precisely — and makes the payoff from reducing it reliable and permanent.
The numbers are larger than most homeowners expect. A modest 20-fixture halogen landscape system using common 35W MR16 bulbs, running 6 hours per night, consumes approximately 1,533 kilowatt-hours of electricity per year. At the US national average grid carbon intensity of 0.867 lbs CO2 per kWh for delivered electricity (EPA 2022 data), that system produces about 1,329 lbs — roughly 0.6 metric tons — of CO2 annually. Converting every one of those fixtures to a 5W LED drops annual consumption to 109.5 kWh and annual CO2 to approximately 95 lbs. That single change eliminates 1,234 lbs of CO2 per year, year after year, for as long as the system operates.
Over 10 years, a 20-fixture LED conversion avoids more than 6 metric tons of CO2 compared to running the same halogen system. To put that in context: the EPA estimates that one metric ton of CO2 is roughly equivalent to the annual emissions from driving a gasoline passenger car approximately 2,400 miles. Six metric tons is the equivalent of removing a car from the road for more than a year. These are not trivial numbers for what most people consider a minor decorative amenity.
This guide gives you the tools to calculate your own system's exact carbon output, understand how your state's grid affects those numbers, identify every source of lighting-related carbon you may be missing (the transformer standby load is the most commonly overlooked), and make decisions ranked by their actual impact on your footprint rather than their perceived greenness. See also the companion guides: solar vs low voltage energy efficiency, minimizing voltage drop energy waste, and smart outdoor lighting controls guide.
The Landscape Lighting Carbon Footprint Formula
Calculating your landscape lighting system's annual carbon footprint requires four inputs: total system wattage, daily runtime hours, your state's grid carbon intensity, and the number of days per year the system operates (typically 365). Here is the complete formula and the variables you need to populate it.
Finding Your State's Emission Factor
The emission factor (EF) is the single variable that most affects your result — and the one most people default-estimate incorrectly. The EPA national average for delivered electricity is 867.5 lbs CO2 per MWh (0.867 lbs per kWh) for 2022, which accounts for transmission and distribution losses of 5.12%. This is the number to use if you do not know your state's specific figure.
However, state-level figures vary enormously. Vermont's grid is near zero-carbon at approximately 8–12 lbs CO2/MWh (0.008–0.012 lbs/kWh), primarily due to nuclear and Canadian hydro imports. West Virginia's coal-heavy grid produces approximately 1,700–1,970 lbs CO2/MWh (1.70–1.97 lbs/kWh). Using the wrong emission factor can lead you to miscalculate your system's footprint by a factor of 100 or more. See the state grid intensity table below for specific figures. For the most current data, use the EPA's eGRID database or the EIA's state-level electricity generation data.
Worked Examples: Halogen vs LED vs Integrated LED
The following examples use the same 20-fixture, 6-hours-per-night, year-round scenario at the US national average emission factor of 0.867 lbs CO2/kWh. All math is shown step by step so you can substitute your own numbers.
Carbon Emissions Comparison: Visual Overview
US Grid Intensity: Your State Has a Huge Effect on Your Footprint
The carbon intensity of US electricity varies more than 200-fold from the cleanest state to the dirtiest. This means your landscape lighting system's carbon footprint is as much a function of where you live as what you light it with. The same LED system in Vermont produces nearly no operating carbon. The same system in West Virginia produces significant carbon even with efficient LEDs.
According to EIA data, in 2020 the carbon intensity of US power generation averaged 854 lbs CO2/MWh nationally — but Vermont's was approximately 8.4 lbs CO2/MWh (the lowest in the nation, due to nuclear power and Canadian hydro imports), while high-coal states exceeded 1,900 lbs CO2/MWh. The Ember report for 2024 places the US national average generation intensity at 384 gCO2/kWh (down from 393 in 2023), continuing a long-term decline as coal gives way to natural gas, wind, and solar. Using the EPA's delivered electricity figure of 867.5 lbs CO2/MWh for 2022 (which adds transmission and distribution losses) is the most conservative and accurate approach for a home energy calculation.
The environmental impact of a lighting system is not determined by electricity use alone. Fixture lifespan, replacement frequency, maintenance requirements, driver failures, and material durability all influence the true footprint of a lighting installation over time. A fixture that consumes slightly more energy may actually generate less waste if it lasts twice as long. For a deeper analysis of long-term ownership costs and sustainability tradeoffs, review our lighting life-cycle cost analysis guide, which examines how energy, maintenance, replacement cycles, and service life interact over the lifespan of a lighting system.
The environmental cost of outdoor lighting rises sharply when fixtures are replaced prematurely. Climate-inappropriate materials can turn a repairable system into a repeated cycle of failed drivers, cracked plastic stakes, corroded housings, and discarded integrated LED fixtures. The Outdoor Lighting Climate Performance Guide helps match materials and maintenance practices to heat, salt, humidity, snow, UV, soil, and irrigation exposure so the original equipment remains in service longer.
Washington ~50–80 lbs CO₂/MWh — Columbia R. hydropower
Oregon ~100–140 lbs CO₂/MWh — hydro + growing wind
California ~400–500 lbs CO₂/MWh — large solar + hydro
Idaho ~60–100 lbs CO₂/MWh — predominantly hydroelectric
In these states, even a halogen system has a relatively small absolute carbon footprint. But LED still reduces it dramatically, and the money savings are identical everywhere.
Florida ~900–1,100 lbs CO₂/MWh — heavily natural gas
Georgia ~800–1,000 lbs CO₂/MWh — gas + nuclear mix
Colorado ~700–900 lbs CO₂/MWh — transitioning coal to wind
Kansas ~700–900 lbs CO₂/MWh — large wind addition
At these levels, a 20-fixture halogen system produces 1,100–1,700 lbs CO₂/year. LED conversion is strongly justified on both carbon and cost grounds.
Wyoming ~1,700–1,900 lbs CO₂/MWh — large coal generation
Kentucky ~1,400–1,600 lbs CO₂/MWh — coal-heavy grid
Indiana ~1,200–1,500 lbs CO₂/MWh — coal base load
Missouri ~1,200–1,400 lbs CO₂/MWh — coal + gas mix
In high-coal states, a 20-fixture 35W halogen system can produce 2,500–3,000+ lbs CO₂/year. LED conversion avoids over 2,000 lbs annually.
What Your State's Grid Means for LED Upgrade Priority
In low-carbon grid states (Vermont, Washington, Oregon), LED conversion still makes strong financial sense — you eliminate a large electricity cost — but the absolute carbon savings are smaller in raw numbers. The LED argument in these states rests more on cost and fixture longevity than on dramatic CO2 reduction.
In high-carbon grid states (West Virginia, Wyoming, Kentucky, Indiana), LED conversion is one of the most impactful residential decarbonization actions available. A single 20-fixture halogen conversion in West Virginia avoids more CO2 per year than removing a car from the road. If you live in a coal-heavy state and have halogen landscape lighting, converting to LED is not a marginal green choice — it is a meaningful environmental action with an approximate 2-year financial payback at current electricity rates.
The environmental impact of a landscape lighting system is not only determined by wattage. Replacement cycles also matter. A fixture that requires repeated bulb changes, socket repairs, or early replacement can create more material waste over time than its energy use alone suggests. Our integrated LED vs. socketed lifespan comparison explains how fixture design affects maintenance frequency, replacement waste, service life, and long-term sustainability.
The "your state matters" point also applies in the opposite direction from what most people expect. Homeowners in Washington or Oregon sometimes assume their electricity is clean and don't bother converting their halogen landscape lighting — reasoning that the carbon impact is minimal. While the absolute CO2 savings are smaller in these states, the financial savings are identical (electricity costs the same per kWh regardless of its source), and halogen bulb replacement labor and cost is eliminated. Even in the cleanest grid states, there is no carbon or financial reason to keep running halogen landscape lighting.
State Grid Intensity Reference Table: lbs CO₂ per kWh
The following table provides approximate grid emission factors by US region and representative states, sourced from EIA state-level electricity data and the EPA eGRID dataset. Use these to populate the EF variable in the carbon formula above. All values are approximate generation-level intensities — add approximately 5% for transmission and distribution losses to get delivered electricity intensity.
| Region / State(s) | Approx. lbs CO₂/kWh (generation) | Approx. lbs CO₂/kWh (delivered +5%) | Primary Generation Sources | Annual CO₂ — 20-fixture 35W halogen, 6 hrs | Annual CO₂ — 20-fixture 5W LED, 6 hrs |
|---|---|---|---|---|---|
| Vermont | ~0.004–0.008 lbs/kWh | ~0.008–0.012 lbs/kWh | Nuclear, Canadian hydro imports | ~12–18 lbs CO₂/yr | ~1–2 lbs CO₂/yr |
| Washington, Oregon, Idaho | ~0.03–0.07 lbs/kWh | ~0.05–0.09 lbs/kWh | Hydroelectric (Columbia R.), wind | ~77–138 lbs CO₂/yr | ~5–10 lbs CO₂/yr |
| California | ~0.20–0.26 lbs/kWh | ~0.21–0.27 lbs/kWh | Natural gas, large-scale solar, hydro | ~322–414 lbs CO₂/yr | ~23–30 lbs CO₂/yr |
| New England (MA, CT, RI, ME, NH) | ~0.34–0.40 lbs/kWh | ~0.36–0.42 lbs/kWh | Natural gas, nuclear, offshore wind (growing) | ~552–645 lbs CO₂/yr | ~39–46 lbs CO₂/yr |
| New York | ~0.28–0.34 lbs/kWh | ~0.29–0.36 lbs/kWh | Nuclear, hydro, natural gas | ~445–552 lbs CO₂/yr | ~32–39 lbs CO₂/yr |
| Texas (ERCOT) | ~0.40–0.52 lbs/kWh | ~0.42–0.55 lbs/kWh | Natural gas, large wind, growing solar | ~645–844 lbs CO₂/yr | ~46–60 lbs CO₂/yr |
| Southeast (GA, FL, SC, NC) | ~0.42–0.58 lbs/kWh | ~0.44–0.61 lbs/kWh | Natural gas, nuclear, some coal | ~675–936 lbs CO₂/yr | ~48–67 lbs CO₂/yr |
| Midwest (OH, MI, IL, WI, MN) | ~0.50–0.70 lbs/kWh | ~0.53–0.74 lbs/kWh | Natural gas, coal (declining), nuclear, growing wind | ~813–1,135 lbs CO₂/yr | ~58–81 lbs CO₂/yr |
| Mid-Atlantic (PA, MD, VA, NJ, DE) | ~0.42–0.55 lbs/kWh | ~0.44–0.58 lbs/kWh | Natural gas, nuclear, some coal | ~675–890 lbs CO₂/yr | ~48–64 lbs CO₂/yr |
| Mountain West (CO, UT, AZ, NM) | ~0.55–0.75 lbs/kWh | ~0.58–0.79 lbs/kWh | Natural gas, coal, growing solar and wind | ~890–1,212 lbs CO₂/yr | ~64–87 lbs CO₂/yr |
| Indiana, Missouri, Kansas | ~0.60–0.80 lbs/kWh | ~0.63–0.84 lbs/kWh | Coal (heavy), natural gas, growing wind | ~967–1,289 lbs CO₂/yr | ~69–92 lbs CO₂/yr |
| Kentucky, West Virginia, Wyoming | ~0.80–1.00 lbs/kWh | ~0.84–1.05 lbs/kWh | Predominantly coal | ~1,289–1,610 lbs CO₂/yr | ~92–115 lbs CO₂/yr |
| US National Average | ~0.41 lbs/kWh (Ember 2024 gen.) | ~0.867 lbs/MWh → 0.867 lbs/kWh (EPA 2022 delivered) | Mixed — gas, coal, nuclear, wind, solar | ~1,329 lbs CO₂/yr | ~95 lbs CO₂/yr |
The Hidden Carbon Source: Transformer Standby Load
Every landscape lighting transformer consumes power continuously whenever it is plugged in and energized — even when no fixtures are lit, even during daylight hours, even when the timer is in the OFF position but the transformer remains connected to the outlet. This "no-load" or "standby" consumption comes from core losses in the transformer's magnetic circuit, and it is the most commonly overlooked source of landscape lighting carbon that homeowners miss entirely when calculating their system's footprint.
Small consumer landscape lighting transformers consume approximately 1–5 watts of no-load power. Larger magnetic EI-core transformers (the type commonly used in 120W–300W consumer landscape transformers) sit at the higher end of this range. The consumer electronics industry broadly documents that small plug-in transformers consume 1–5W when energized with no load — in the words of HowStuffWorks: "The power consumption is not large — on the order of 1 to 5 watts per transformer. But it does add up."
Energized 24 hrs/day × 365 days = 8,760 hours/year
5W × 8,760 hrs ÷ 1,000 = 43.8 kWh/year wasted in standby alone
At 0.867 lbs CO₂/kWh: 38 lbs CO₂/year — before a single fixture lights up
This is why traditional EI-core landscape transformers hum when plugged in. That hum is the sound of core losses — eddy currents and hysteresis losses converting electricity to heat in the iron core. It is audible confirmation of wasted energy. If your transformer is warm to the touch when the lights are off, standby losses are occurring.
1W × 8,760 hrs ÷ 1,000 = 8.76 kWh/year standby
At 0.867 lbs CO₂/kWh: 7.6 lbs CO₂/year standby
Toroidal core transformers (like the Hampton Bay SL-series) have a wound core geometry that significantly reduces eddy current losses compared to stacked EI laminations. They are quieter, cooler, and waste less energy at idle. Electronic switched-mode transformers used in newer landscape systems can have standby losses below 0.5W. If you are replacing a transformer, no-load loss is a specification worth checking.
How to Eliminate Transformer Standby Carbon
The complete solution is to use a timer or smart outlet that fully de-energizes the transformer's 120V power supply during daylight hours. A transformer that is completely unplugged (or whose outlet is switched off by a timer) consumes zero standby watts — core losses cannot occur without energization. The typical landscape lighting transformer is plugged in and energized 24 hours a day for convenience but only needs to be active for 5–8 hours each night. Configuring a 24-hour timer on the outlet controlling the transformer so it is only energized from 30 minutes before dusk to 30 minutes after the lights-off time eliminates 16–19 hours of standby losses daily.
On a 5W standby transformer, this reduces standby waste from 43.8 kWh/year to approximately 8–11 kWh/year — avoiding 28–31 lbs CO2 annually from standby alone. For the transformer selection and configuration process, see the landscape lighting transformer sizing guide and the landscape lighting timer setup guide. For smart-outlet control to de-energize transformers remotely, see the smart outdoor lighting controls guide.
Timer & Runtime Optimization: The Second Biggest Carbon Lever
After switching from halogen to LED (the biggest single action), the second most impactful carbon reduction strategy is reducing how many hours your system runs each night. A dusk-to-dawn schedule can run 9–12 hours per night in winter. Switching to a dusk-to-midnight schedule on the same fixtures cuts runtime by 50–70% in those months — and cuts carbon output proportionally.
The Three Runtime Strategies
Dusk to dawn (photocell only, no timer cutoff): The lights stay on all night until sunrise. This is appropriate for security perimeter lighting where consistent illumination is a priority. Energy consumption and carbon output are at maximum. A 100W LED system running dusk-to-dawn year-round in Kansas City (dusk averages 8.5 hours earlier than dawn on December 21) consumes approximately 855–1,095 kWh/year depending on season averaging. At $0.16/kWh, that is $137–$175/year just for the electricity.
Dusk to midnight (timer-set shutoff): The lights run from sunset to a fixed midnight cutoff. This matches peak outdoor activity hours — nearly no homeowner is outside enjoying landscape lighting at 3 AM, and most burglaries occur in the early-to-mid evening rather than deep at night. A dusk-to-midnight schedule reduces runtime by approximately 35–50% compared to dusk-to-dawn in summer and 40–60% in winter (due to longer winter nights). Tru-Scapes describes this as the "Goldilocks" solution: the photocell activates at dusk automatically so you never need to adjust for seasonal sunset time changes, and the timer cuts off at midnight regardless.
Dusk-to-timer combo (photocell on, timer off): This is the optimal setup for decorative landscape lighting in residential use. The photocell handles dusk activation automatically — no manual adjustment for Daylight Saving Time or seasonal sunset shifts. The timer handles shutoff at whatever hour you choose. Energy savings compared to dusk-to-dawn are substantial: up to 40–50% reduction in annual energy consumption and proportional carbon reduction. According to energy studies cited by PacLights, dusk-to-dawn systems can reduce energy consumption by up to 40% compared to always-on systems when combined with timer cutoffs.
Runtime Carbon Calculation: Dusk-to-Dawn vs Dusk-to-Midnight
| Schedule | Avg. Hours/Night | Annual kWh (20×5W LED) | Annual CO₂ (US avg.) | Savings vs Dusk-to-Dawn |
|---|---|---|---|---|
| Dusk to dawn (all night) | ~9.5 hrs (annual avg.) | 347 kWh | 301 lbs CO₂ | Baseline |
| Dusk to midnight | ~5.0 hrs (annual avg.) | 183 kWh | 159 lbs CO₂ | 47% reduction, ~142 lbs CO₂ saved |
| Dusk to 11 PM | ~4.0 hrs (annual avg.) | 146 kWh | 127 lbs CO₂ | 58% reduction, ~174 lbs CO₂ saved |
| Dusk to 10 PM | ~3.0 hrs (annual avg.) | 110 kWh | 95 lbs CO₂ | 68% reduction, ~206 lbs CO₂ saved |
| Motion-sensor accent zones (security only) | ~0.5 hrs equiv. | 18 kWh | 16 lbs CO₂ | 95% reduction — lowest possible footprint |
For timer configuration options by transformer model, see the landscape lighting timer setup guide. For the full range of smart controls that enable dynamic scheduling, see the smart outdoor lighting controls guide. Motion sensors for security perimeter zones can be combined with timed accent lighting to achieve the overall lowest-carbon scheme — security zones activate only on motion, ambient accent lighting runs a shorter timed schedule.
Embodied Carbon: LED vs Halogen Manufacturing Impact & the 63-Hour Breakeven
Embodied carbon refers to CO2 generated during the manufacturing, transportation, and end-of-life disposal of a product — separate from the operational carbon produced while the product is in use. LED landscape lights have significantly higher manufacturing carbon than halogen bulbs, which are mechanically simple products with low embodied energy. This is a real consideration, but the breakeven point where LED's operational savings exceed its manufacturing carbon premium is remarkably fast.
These figures are sourced from Austep Lighting's analysis of Osram lifecycle data. The manufacturing carbon premium of the LED over the halogen is 2.4 − 0.33 = 2.07 kg CO₂e. The LED saves 0.0395 − 0.00632 = 0.0332 kg CO₂e per hour of operation compared to the halogen. Dividing the carbon premium by the hourly savings: 2.07 ÷ 0.0332 = 62.3 hours — or roughly 10–11 days of typical 6-hour-per-night landscape lighting operation.
After those first 63 hours of operation, the LED has fully paid back its higher manufacturing carbon and every subsequent hour generates net carbon savings compared to continuing with halogen. Over 25,000 hours of LED life, total CO2 is approximately 160 kg vs 990 kg for the halogen — an 84% reduction across the full lifecycle including manufacturing. The embodied carbon argument against LED is not a meaningful objection to LED conversion for landscape lighting applications.
End-of-Life Carbon: LED Disposal Considerations
LEDs contain electronic components — circuit boards, drivers, semiconductor materials — that should not go to general landfill. Improper disposal of LED fixtures contributes to heavy metal leaching (some LEDs contain small quantities of arsenic, lead solder, or other substances) and electronic waste streams. The responsible end-of-life path for LED landscape fixtures is through an e-waste recycling facility. Many municipalities offer e-waste drop-off; Home Depot and Best Buy also accept LED products for recycling. This is a consideration for integrated LED fixtures more than for replaceable LED bulbs in traditional fixture housings — bulbs themselves have minimal e-waste impact. Choosing fixtures with replaceable LED modules rather than integrated LED designs extends fixture life and reduces the total quantity of fixture-body material going to disposal over a system's lifespan. For durable fixture material selection, see the durable landscape lighting materials guide.
Solar vs Wired Landscape Lighting: The Real Carbon Comparison
The conventional assumption is that solar landscape lighting is automatically greener than wired. This is true in most cases — but the actual comparison is more nuanced than "solar = zero carbon." Solar lights have manufacturing carbon from the solar panel and battery, battery replacement every 2–3 years creates recurring embodied carbon, and improper battery disposal is the technology's biggest environmental liability. Wired LED powered by a clean grid or home solar can match or outperform standalone solar on lifetime carbon in low-carbon grid states.
Manufacturing carbon: LED fixture + transformer. Low embodied carbon in fixture; transformer has modest manufacturing impact.
Battery waste: None. No battery disposal concern.
Performance reliability: Consistent every night regardless of cloud cover, season, or daylight hours.
Best for: States with clean grids (WA, OR, VT, CA, NY). Any grid when paired with home solar or a green energy tariff. Applications needing consistent, high-quality illumination.
Manufacturing carbon: Solar panel + LiFePO4 or NiMH battery. Battery manufacturing has meaningful embodied carbon. Each 18500 LiFePO4 cell requires lithium mining, cathode manufacturing, and assembly energy.
Battery replacement: Every 2–3 years. Each replacement cycle adds embodied carbon. Over 10 years: 3–5 battery sets per fixture. This is the environmental weak point of solar landscape lighting.
Battery waste: LiFePO4 and NiMH batteries must not go to landfill — heavy metal leaching risk. Proper disposal through battery recycling programs is required but rarely followed by homeowners.
Performance limitations: Cloudy regions cut output by up to 50%. Winter days may be too short for full charge in high-latitude locations. Not suitable for dense shade installations.
Battery waste: None. The energy storage is handled by the grid or the home solar system — the landscape lighting itself uses no batteries.
Performance reliability: Consistent nightly performance identical to standard grid-powered wired LED — no weather dependence for the lighting itself.
Best for: Homes with existing rooftop solar. Homeowners enrolled in green energy tariffs from their utility. Highest-quality landscape illumination with the lowest overall carbon footprint.
The Battery Replacement Carbon Problem
The most significant but least-discussed environmental issue with solar landscape lighting is the recurring carbon cost of battery replacement. Consumer-grade solar landscape lights typically use LiFePO4 (lithium iron phosphate), NiMH (nickel metal hydride), or NiCd (nickel cadmium) batteries in 14430 or 18500 formats. These batteries require replacement every 2–3 years under normal use conditions.
Battery manufacturing research indicates that lithium-ion battery production generates 40–60 kg CO2 per kWh of battery capacity. A 14430 LiFePO4 cell used in landscape lighting has approximately 0.4 mAh capacity at 3.2V — roughly 0.00128 kWh. Even at the high end of the manufacturing emission range, a single cell generates 0.052–0.077 kg CO2 during manufacturing. The manufacturing carbon per battery is modest — the problem is volume and disposal. A 20-fixture solar system replacing batteries every 2–3 years over 10 years generates 60–100 battery replacement events. Multiplied across millions of solar landscape lights in use nationally, battery disposal is a significant and growing waste stream.
Forigat's analysis estimates solar landscape lighting saves 0.5–1 kg CO2 per light per year compared to grid-powered equivalents (in high-carbon grid regions). This is a genuine and meaningful carbon benefit in states where the grid is coal-heavy. In low-carbon states, the carbon math narrows considerably. The definitive answer to "solar vs wired" for carbon is: it depends on your grid. For the complete energy comparison beyond carbon alone, see the solar vs low voltage energy efficiency guide.
The carbon math for solar landscape lighting is better than the practical experience suggests in cloudy climates. I regularly encounter solar landscape systems in the Pacific Northwest, New England, and Great Lakes regions where the panels are shaded by trees or simply do not receive enough daily sun to fully charge batteries year-round. The result is lights that work reasonably well in summer and perform poorly from October through March. In these climates, wired LED powered by Pacific Northwest hydroelectric or New England's growing offshore wind portfolio produces lower operating carbon AND more reliable year-round performance. Solar landscape lighting earns its environmental credentials primarily in sunny climates with carbon-heavy grids — the Southwest is the perfect scenario; coastal Oregon is not.
The 8-Step Landscape Lighting Carbon Reduction Checklist, Ranked by Impact
The following actions are ranked from highest to lowest carbon reduction impact for a typical residential landscape lighting system. Complete Step 1 before worrying about Steps 7 or 8 — the early steps deliver exponentially more carbon reduction per dollar and hour invested than the later ones. Each step also includes the carbon avoided and the secondary cost or effort involved.
-
1Switch All Halogen Fixtures to LED — Same Fixture, New Bulb★★★★★ HIGHEST IMPACT — Up to 93% CO₂ reduction on fixture operating emissionsThis single action eliminates 75–93% of your landscape lighting's operational carbon footprint. A 20-fixture system converting from 35W halogen to 5W LED avoids approximately 1,234 lbs CO₂ per year at the US grid average, and proportionally more in coal-heavy states. The cost is LED replacement bulbs at $3–12 per bulb depending on base type (G4, GU5.3, PAR36). Financial payback is typically 12–24 months from electricity savings alone. LED payback of manufacturing carbon vs halogen occurs in 63 hours — less than 2 weeks of normal runtime. This is not a marginal improvement. It is the core action from which all other steps build. For LED replacement bulb specifications, see the LED vs halogen guide.
-
2Set a Timer Cutoff: Switch from Dusk-to-Dawn to Dusk-to-Midnight★★★★☆ HIGH IMPACT — 35–50% reduction in operating hours and proportional CO₂After LED conversion, runtime reduction is the next largest lever. Switching from dusk-to-dawn to dusk-to-midnight on a 20-fixture 5W LED system reduces annual energy from ~347 kWh to ~183 kWh and avoids an additional 142 lbs CO₂/year at the US grid average. Cost: zero if your transformer already has a timer — it's a setting change. If your transformer lacks a timer, a replacement or add-on timer costs $20–60. The landscape looks identical to anyone inside the home after midnight because no one is observing it. For timer configuration, see the timer setup guide.
-
3De-Energize the Transformer During Daytime Hours★★★★☆ HIGH IMPACT — Eliminates 7–38 lbs CO₂/year of transformer standby wasteInstall a 24-hour outlet timer on the transformer's power supply so it is only energized from 30 minutes before sunset to 30 minutes after the lights-off cutoff. A traditional EI-core transformer running 24 hours/day wastes 3–5W continuously; limiting to 6–8 hours/day cuts standby from 26–44 kWh/year to 6–12 kWh/year. Cost: a basic outlet timer costs $8–15. This is a zero-expertise action that takes 5 minutes. It also extends transformer life by reducing core heating cycles. See the transformer guide.
-
4Audit and Remove Redundant Fixtures★★★☆☆ MEDIUM IMPACT — Proportional to fixtures removedMany landscape lighting systems were designed with more fixtures than the illumination task actually requires — especially systems that have been expanded incrementally over years without a plan. Professionally designed systems use fewer, better-positioned fixtures than DIY installations. A fixture audit — walking your property at night and identifying which lights add visual value versus which create glare or overlap redundantly — often reveals 20–40% of fixtures that can be removed with no perceived loss of illumination quality. Removing 4 fixtures from a 20-fixture 5W LED system running 6 hrs/night saves 131 kWh/year and 114 lbs CO₂/year. See the landscape lighting layout guide.
-
5Upgrade to a Toroidal or Electronic Transformer with Lower Standby Losses★★★☆☆ MEDIUM IMPACT — Combined with Step 3, further reduces standby carbonWhen your existing transformer reaches end of life, replace it with a toroidal-core model (Hampton Bay SL-series, for example) or an electronic switched-mode transformer. Toroidal designs reduce no-load losses from 3–5W to 1–2W due to their wound-core geometry — quieter and cooler in operation. At 24 hours/day energization, this saves 8–26 kWh/year in standby. Combined with Step 3 (daytime de-energization), total standby carbon approaches near zero. For transformer comparison and selection, see the transformer sizing guide.
-
6Add Motion Sensors to Security Zones★★★☆☆ MEDIUM IMPACT on security fixture energy; zero impact on accent lightingMotion-sensor controls on security perimeter lighting — garage areas, side yards, rear access points — reduce those fixtures' runtime from all-night to motion-activated bursts averaging 15–30 minutes per night total. A 10W LED security flood on motion sensing uses approximately 3–5 kWh/year versus 146–219 kWh/year running all night. The CO₂ reduction is proportional and can be substantial if you have multiple high-wattage security fixtures. Smart motion sensors also improve security effectiveness by providing a more conspicuous on-state alerting cue when movement is detected. See the smart lighting controls guide.
-
7Optimize Voltage Drop to Reduce Wasted Energy in the Wire★★☆☆☆ LOWER IMPACT — Prevents waste but not as large as fixture or runtime changesVoltage drop in landscape wire runs causes fixtures to dim without producing proportionally less CO2 — the transformer still draws current to push electricity through resistive wire, and the lost voltage appears as heat in the wire rather than light at the fixture. Correcting voltage drop (upgrading wire gauge, shortening runs, using the transformer's multi-tap terminals to compensate) ensures every watt drawn from the transformer actually reaches the fixture as intended light output. For small LED systems, voltage drop impact is modest. For longer runs with more fixtures, it matters more. For the analysis, see the minimizing voltage drop guide.
-
8Switch Your Home Electricity Supply to a Renewable Energy Tariff★★★★★ HIGHEST ABSOLUTE IMPACT but applies to your entire home, not just lightingThis is listed last not because it is unimportant — it is the most impactful single action for total household carbon — but because it operates at the whole-home level and is not specific to landscape lighting. Enrolling in a green energy tariff from your utility (available in many states, typically at a small premium) sets your electricity emission factor to near zero for all household consumption including landscape lighting. If you have already done Steps 1–3, the residual carbon from a 5W LED landscape system running 6 hours per night is already very small. A green energy tariff effectively reduces it to near zero. If you have not done Steps 1–3, green tariffs are still valuable but do not substitute for efficient fixtures. Do both. See solar vs low voltage efficiency for the renewable energy angle.
Additional Context: What Your Landscape Lighting Carbon Compares To
Context helps prioritize action. Here is how the landscape lighting carbon footprint of common system configurations compares to other household and personal carbon activities, using EPA equivalency metrics.
| Activity / Source | Annual CO₂ Equivalent | Comparison to 20-Fixture Halogen (1,329 lbs/yr) |
|---|---|---|
| 20-fixture 35W halogen system, 6 hrs/night | 1,329 lbs (603 kg) CO₂/yr | Baseline |
| Driving a gasoline passenger car 1,400 miles | ~1,309 lbs CO₂ | Roughly equivalent to the halogen system's annual output |
| Average US passenger car, annual driving (14,000 miles) | ~11,435 lbs CO₂/yr | 8.6× more than the halogen landscape system |
| Round-trip transatlantic flight (economy, per person) | ~2,000–3,000 lbs CO₂ | 1.5–2.3× the halogen system's annual output |
| 20-fixture 5W LED system, 6 hrs/night | 190 lbs (86 kg) CO₂/yr | 14.3% of halogen baseline; savings = 1,139 lbs/yr |
| 20-fixture 5W LED, dusk-to-midnight (5 hrs) | 159 lbs CO₂/yr | 12% of halogen baseline |
| One mature tree absorbing CO₂ (annual) | ~48 lbs CO₂ absorbed/yr | The halogen system's annual output requires ~28 trees to offset |
| Charging a smartphone daily for a year | ~4–8 lbs CO₂/yr | The halogen system emits ~200× more than annual phone charging |
| Running a standard home refrigerator | ~430 lbs CO₂/yr | The halogen landscape system emits 3× as much as your refrigerator |
The comparison that most surprises homeowners: a standard 20-fixture halogen landscape system running 6 hours per night produces approximately three times the annual carbon of a modern Energy Star refrigerator. The landscape lighting carbon reduction opportunity is larger than most people expect for what seems like a minor decorative amenity. Converting to LED is accordingly more impactful than it appears.
For related sustainable lighting topics and the full sustainable lighting index for this site, see: dark-sky compliance guide, wildlife-friendly outdoor lighting, outdoor lighting ordinance guide, landscape lighting color temperature guide, biological impact of outdoor light color, landscape lighting energy calculator, and outdoor lighting and human health.
Landscape Lighting Carbon Footprint FAQ
How do I calculate the carbon footprint of my landscape lighting system?
Use the formula: (Total watts ÷ 1,000) × hours per night × 365 × your state's CO₂ emission factor (lbs/kWh). For example: 20 fixtures × 35W = 700W total. (700 ÷ 1,000) × 6 hrs × 365 = 1,533 kWh/year. At the US average of 0.867 lbs CO₂/kWh: 1,533 × 0.867 = 1,329 lbs CO₂ per year. Use your state's specific emission factor from the table in this guide for a more accurate result. For the interactive calculation tool, see the energy calculator.
Does my state's electricity source affect my landscape lighting carbon footprint?
Yes, enormously. Vermont's grid produces approximately 8–12 lbs CO₂ per MWh. West Virginia's produces approximately 1,700–1,970 lbs CO₂ per MWh. The same LED landscape system in West Virginia has a carbon footprint roughly 200 times larger than the identical system in Vermont. Your state's grid carbon intensity is as important as your fixture wattage when calculating your actual footprint. See the state grid intensity table in this guide for reference figures.
Is solar landscape lighting always better for the environment than wired LED?
Not always. In high-carbon-grid states (West Virginia, Wyoming, Kentucky), solar landscape lighting clearly avoids significant operating emissions. In low-carbon states (Vermont, Washington, Oregon, California), wired LED powered by near-clean electricity can have a lower or similar lifecycle footprint to solar when recurring battery replacement is factored in. The best option in any location is wired LED powered by a green energy tariff or home solar — consistent performance with near-zero operating carbon and no battery disposal concern.
How much does transformer standby power affect my lighting carbon footprint?
A traditional EI-core landscape transformer consumes 3–5 watts continuously whenever it is plugged in — even during daylight hours when no fixtures are lit. At 24 hours/day energization, this adds 26–44 kWh/year in standby waste before any fixtures turn on, generating 22–38 lbs CO₂/year. The fix is a 24-hour outlet timer that de-energizes the transformer during daylight hours. This standby load is absent from most online carbon calculators and represents 5–25% of total landscape lighting electricity consumption in some systems. See the transformer standby section of this guide.
How long does it take for an LED bulb's manufacturing carbon to pay back vs halogen?
Based on Osram lifecycle data, approximately 63 hours of use — less than 2 weeks of typical 6-hour-per-night landscape lighting operation. The LED requires more manufacturing energy (~2.4 kg CO₂e vs ~0.33 kg CO₂e for halogen), but generates 84% less CO₂ per hour of operation. After 63 hours, the LED has returned its manufacturing carbon premium and generates net carbon savings for every additional hour it operates. Over 25,000 hours of LED life, total lifecycle CO₂ is ~84% lower than running the equivalent halogen.
What is the biggest single action to reduce landscape lighting carbon?
Switching from halogen to LED bulbs or fixtures. This eliminates 75–93% of your landscape lighting's operational carbon footprint — the exact reduction depends on the wattage difference between your old and new bulbs. A system running 20 × 35W halogens converted to 20 × 5W LEDs avoids approximately 1,139–1,800 lbs of CO₂ per year depending on your state's grid intensity. No other single landscape lighting action comes close to this impact. The financial payback is typically 12–24 months from electricity savings; the carbon payback on LED manufacturing is 63 hours.
How does my landscape lighting carbon footprint compare to other home energy uses?
A 20-fixture halogen system running 6 hours per night produces approximately 1,329 lbs CO₂/year at the US grid average — roughly three times the annual carbon of a modern Energy Star refrigerator (~430 lbs/year), and equivalent to driving a gasoline car approximately 1,400 miles. This is why LED conversion of landscape lighting is a more impactful residential decarbonization action than it appears for what seems like a minor outdoor amenity. Converting to LED and running dusk-to-midnight drops the same system's footprint to approximately 159 lbs CO₂/year — a 88% reduction.
Related Sustainable Lighting Guides
- Solar vs Low Voltage Energy Efficiency
- Minimizing Voltage Drop Energy Waste
- Smart Outdoor Lighting Controls Guide
- Dark Sky Compliance Guide
- How to Fix Light Trespass
- Outdoor Lighting Ordinance Guide
- Wildlife-Friendly Outdoor Lighting
- Durable Landscape Lighting Materials
- Biological Impact of Outdoor Light Color
- Landscape Lighting Color Temperature
- Landscape Lighting Energy Calculator
- Lumen Pollution vs Light Pollution
- Dark Sky Fixture Selection Guide
- Outdoor Lighting and Human Health
- Understanding Bug Ratings for Lighting
- LED vs Halogen Landscape Lighting Guide
- Transformer Sizing Guide
- Landscape Lighting Timer Setup
- Voltage Drop Guide
- Landscape Lighting Maintenance
- Low-Voltage Brand Comparison
- Portfolio Lighting Alternatives
- Landscape Lighting Layout Guide
- How to Wire Landscape Lighting