
⚡ Code & Professional Notice: My 7-Point Photometric Validation Protocol
Getting a commercial lighting plan approved by your local authority having jurisdiction (AHJ) requires matching exact manufacturing field data to your site plan, not running a ballpark guess. If you try to submit a permit package built on generic or estimated light spreads, you run a massive risk of your project stalling at the inspection phase when the field measurements don't match your paperwork.
Whenever I draft a layout for a city permit or audit a commercial footprint before submittal, I verify the calculations against these seven strict engineering and code rules:
- 1. Mandatory IES File Verification: I only use certified IES (.ies) data files pulled straight from the exact fixture manufacturer; unverified internet sheets will throw your whole layout grid out of alignment.
- 2. Target Foot-Candle Grid Mapping: I map the minimum and maximum illuminance values across the entire pavement layer to guarantee the plan meets strict local zoning safety targets.
- 3. The Local AHJ Pre-Audit Check: Because municipal lighting ordinances vary wildly from town to town, I always crosscheck our layout values against your specific city's code textbook before filing.
- 4. Hard Property Line Spill Control: I trace the outer property limits to make sure the light drops down to zero foot-candles right at the boundary line, preventing code violations for light trespass.
- 5. True Pole and Mount Height Alignments: I lock in the exact mounting arm angles and pole base heights; a variation of even a foot in the field can completely alter your ground illumination pools.
- 6. Matching Fixture-Specific Optics: I match the specific directional lenses (Type III, Type V, etc.) to the layout plan so the actual light pattern perfectly tracks the pavement geometry.
- 7. Guarding Against Field Rejection Costs: Submitting raw, uncertified data means the building inspector can reject the build on-site, forcing an expensive, late-stage tear-out of mounted hardware.
⚠️ CRITICAL SUBMITTAL RISK: Never copy or guess layout vectors from a sister project. Mismatching the lumen outputs or using blind estimates will trigger a failed field inspection. Check out my full data sets, IES file matching charts, and structural code breakdowns detailed further down this page to lock down your permit approval.
All code limits and illumination data points noted throughout this walkthrough reflect standard industry best practices and active zoning templates. Always verify your local regional requirements directly with your code enforcement office before breaking ground. Full Disclaimer
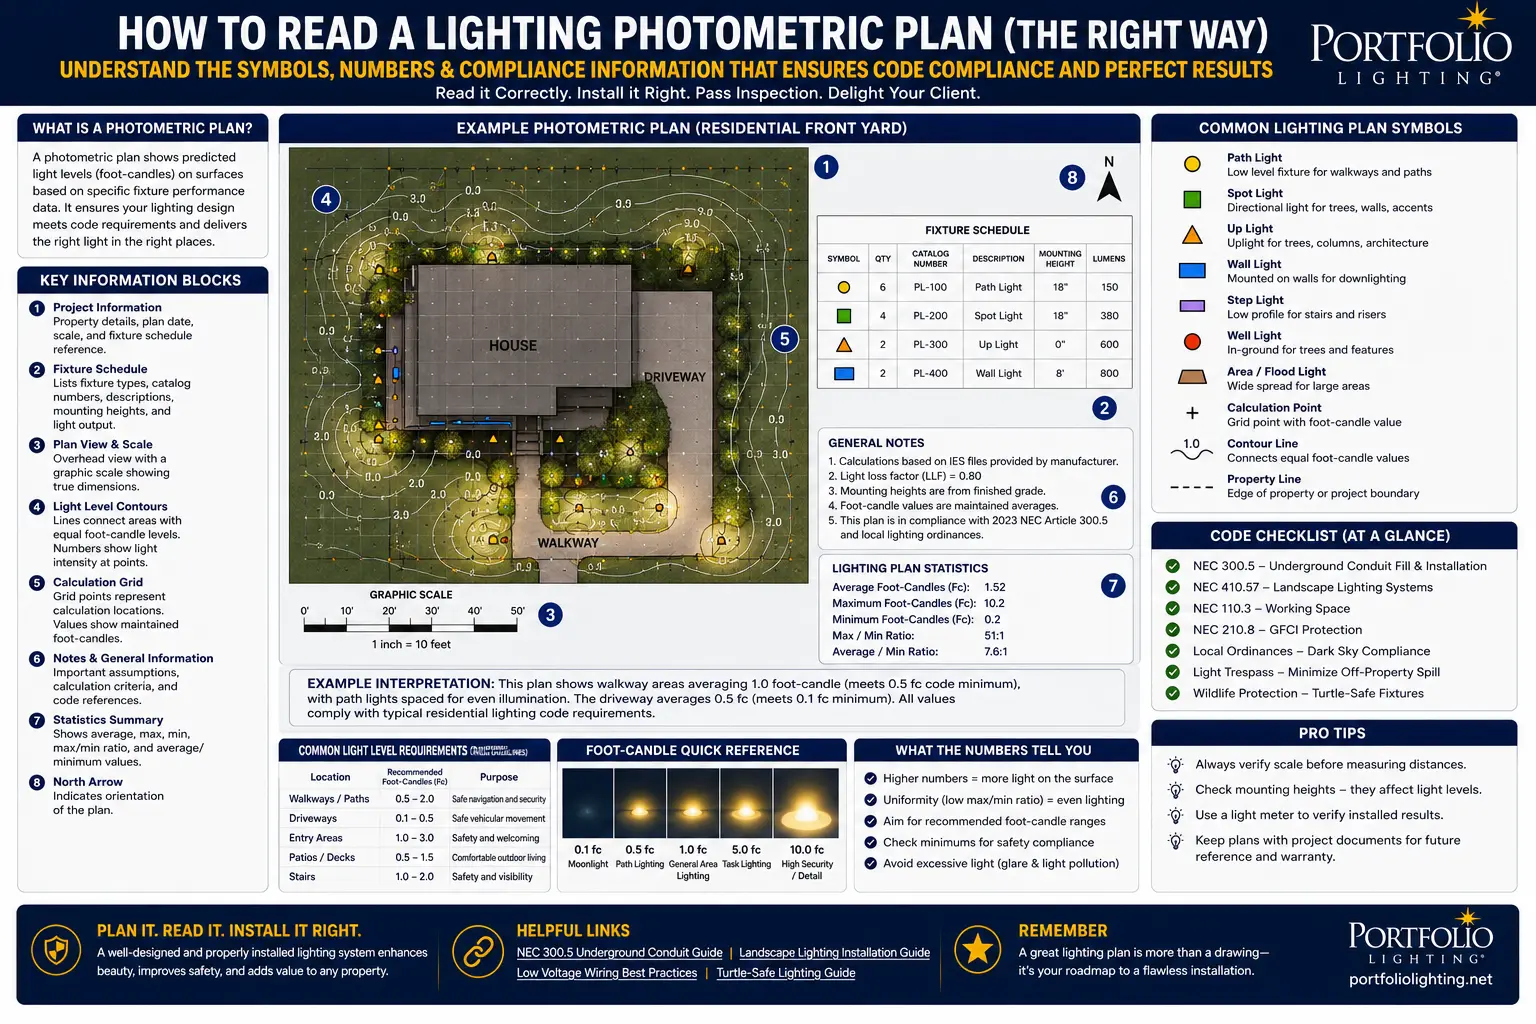
The Five Elements of Every Photometric Plan
Before interpreting any specific number on a photometric plan, identify the five structural elements present on every plan. Not understanding what you're looking at before reading the numbers is the most common starting mistake.
① The Fixture Schedule (Legend)
Every plan has a fixture schedule — a table listing each luminaire type, its tag (A, B, C or A1, B2 etc.), mounting height, wattage, lumen output, IES file source, and orientation. This is your starting point. A fixture tagged "A" on the plan is the same "Type A" in the schedule. Mounting height in the schedule determines the entire illuminance calculation — change the height, change every number. Check that the mounting height shown in the schedule matches what's actually proposed for installation. If a pole fixture is specified at 20 feet but the AHJ has a 16-foot height maximum, every calculation on the plan is wrong.
② The Calculation Grid (Point-by-Point fc)
A regular grid of points — typically on 5-foot, 10-foot, or 20-foot centers — where the software has calculated illuminance at the work plane. Each point shows a foot-candle value. This is the most-read element and the one inspectors check directly. The code minimum illuminance requirement is compared against these values. Dense grids with 5-foot spacing show more detail; coarse 20-foot grids hide dark spots between calculation points that might fail code on a finer grid.
③ Iso-Footcandle Contour Lines
Curved lines connecting points of equal illuminance — exactly like elevation contour lines on a topographic map. Each line is labeled with its fc value (0.5 fc, 1.0 fc, 2.0 fc, 5.0 fc, etc.). Lines close together indicate rapid light level change (steep "slope"); lines far apart indicate gradual change. The 0.5 fc or 1.0 fc contour line is often the critical compliance contour — if code requires 1.0 fc minimum and the 1.0 fc contour line passes through an area required to be illuminated, that area is at the threshold of compliance.
④ Calculation Zone Summary Table
A table showing statistical summaries for each defined calculation zone — average fc, maximum fc, minimum fc, max/min ratio, and average/minimum ratio. This table is what the code inspector typically checks first for compliance. The average fc is compared to minimum illuminance code requirements. The uniformity ratio is compared to uniformity code requirements. Zones are typically defined by function: parking area, pedestrian path, property perimeter, street right-of-way, etc.
⑤ Fixture Polar Plots (Usually in Schedule or Appendix)
Circular charts showing how each fixture distributes light in every direction. These may be embedded in the plan's fixture schedule, provided as a separate photometric report appendix, or both. The polar plot is the fingerprint of the luminaire — it shows beam shape, distribution type, and relative intensity at every angle. This is where the scale trap occurs (see dedicated section below).
⑥ Plan Notes and Calculation Settings
Usually in a notes box or title block — the plan notes specify: work plane height (critical), calculation method, software used, date generated, and any assumptions made. Always read the notes before interpreting numbers. A plan that shows 2.4 fc average in a parking area might have its work plane set at 30 inches above grade instead of grade level — producing inflated numbers that won't match actual ground-level measurements. The notes reveal this.
Reading the Foot-Candle Grid: Units, Values, and What "Calculated" Means
The foot-candle grid is the core of every outdoor photometric plan. It answers the most fundamental compliance question: does this design deliver the required light levels across the space? But foot-candle values are only meaningful if you understand the measurement units, the work plane they're measured at, and the difference between calculated and measured values.
Foot-Candles vs Lux: Which Unit Your Jurisdiction Uses
Illuminance is measured in foot-candles (fc) in the United States, and in lux in most other countries and in metric-system technical specifications. The conversion: 1 foot-candle = 10.764 lux (approximately 10.76 lux per fc). Both measure the same physical quantity — the amount of luminous flux (light) falling on a surface per unit area. The fc measures per square foot; lux measures per square meter.
Most US municipal code requirements cite foot-candles. IES recommended practices are published in both units. If you receive a photometric plan in lux and need to compare it against an fc code requirement, divide the lux value by 10.76. A plan showing 10.76 lux average is equivalent to 1.0 fc average — exactly the IBC egress path minimum. See the complete ADA and IBC lighting requirement framework in the ADA outdoor lighting pathway rules guide.
How Calculated Values Are Generated — and Why They're Not Guaranteed
Every value in the foot-candle grid is a software calculation — not a measured value. The calculation uses the inverse square law (illuminance decreases by the square of the distance from the source) combined with the fixture's IES file data (measured candela values at every angle) and the geometry of the space (fixture positions, mounting heights, surface reflectances). The result is a predicted illuminance at each grid point assuming:
- The fixtures are positioned exactly as shown on the plan
- The mounting heights are exactly as specified
- The IES file used accurately represents the actual fixture's output
- The surface reflectances are correctly assigned (asphalt, concrete, turf all reflect light differently)
- No maintenance factor (light loss factor) reduction has been applied — or the correct one has been
The Calculation Zone Summary: The Three Numbers That Actually Matter for Code
The calculation zone summary table is the first thing a code inspector checks. It summarizes every point in the calculation grid into a handful of statistics. Not all of them are equally important for compliance — here are the three that govern most code requirements.
EXAMPLE: Parking Lot Zone A — Calculation Summary
Stat 1: Average Foot-Candles — The Code Compliance Number
The average fc is what most municipal codes and IES recommended practices cite as the minimum illuminance requirement. If the code says "minimum 1.0 fc average for parking area," the average in the calculation summary must meet or exceed 1.0 fc. Most professional outdoor lighting targets 2–5 fc average for commercial parking. For pedestrian paths, 0.5–1.0 fc average is typical. For areas requiring video security recording capability, 5–10 fc average may be specified.
Stat 2: Minimum Foot-Candles — The Safety and Dark Spot Number
The minimum fc shows the darkest point in the entire calculation zone. This matters independently of the average because: a zone with 2.4 fc average but 0.1 fc minimum has a dangerously dark spot that the average obscures. Some codes specify a minimum fc level in addition to the average — "minimum 1.0 fc average and minimum 0.25 fc at any point." Where no minimum is specified, IES recommends parking area uniformity of 4:1 average-to-minimum, which sets an implicit minimum. The Lighting Research Center at RPI documented that users perceived better safety with more uniform light even at lower average levels — making the minimum as functionally important as the average.
Stat 3: Avg:Min Uniformity Ratio — The Distribution Quality Number
The average-to-minimum uniformity ratio is calculated by dividing the average fc by the minimum fc. In the example above: 2.4 ÷ 0.6 = 4.0, expressed as 4:1. Lower ratios mean more uniform light distribution. Higher ratios mean bright spots surrounded by dark areas — high contrast that creates safety and discomfort issues. Common code and IES targets:
- Commercial parking areas: 4:1 Avg:Min maximum (IES RP-20)
- Pedestrian paths: 4:1 Avg:Min target (IES RP-33)
- Service parking, lower-activity areas: 10:1 Max:Min maximum
- IES general parking: Max:Min not exceeding 15:1 (though 10:1 is preferred)
What the Maximum fc Value Tells You (And What It Doesn't)
The maximum fc value shows the brightest point in the zone — typically directly under a fixture. This number is used in the Max:Min ratio calculation and can indicate potential glare issues if it's extremely high (10+ fc at pedestrian walkway level, for example). However, the maximum fc alone is not the code compliance metric in most jurisdictions — the average is. A zone could theoretically have a very high maximum under a fixture and still pass an average-minimum uniformity test. The maximum is most useful for identifying over-lit spots and potential glare sources, not for primary compliance determination.
Iso-Footcandle Contour Lines: Reading Light Like a Topographic Map
Iso-footcandle contour lines (also called isoline or isophotometric contours) are the visual language of a photometric plan — they let you see the shape and distribution of light at a glance, far faster than reading individual grid point values. Once you understand how to read them, a photometric plan becomes immediately interpretable.
The Topographic Map Analogy
Contour lines on a topographic map connect points of equal elevation. Contour lines on a photometric plan connect points of equal illuminance. The principles are identical: lines close together mean a steep "slope" (rapid light level change); lines far apart mean a gradual change. A cluster of tight contour lines around a fixture indicates it is producing a bright, concentrated "peak" — like a mountain on a topographic map. Widely spaced lines extending out from a fixture indicate broad, gradual light distribution — like a gentle hill.
How to Read Specific Contour Values
Each contour line is labeled with its foot-candle value. Common sets of contours: 0.1, 0.5, 1.0, 2.0, 5.0, 10.0 fc. The contour labeled "1.0" is the 1-foot-candle line — every point exactly on this line receives exactly 1.0 fc of illuminance. All points inside (closer to the fixture) receive more than 1.0 fc; all points outside receive less.
For compliance checking: if the code requires 1.0 fc minimum average and you see that large portions of the calculation zone fall outside the 1.0 fc contour, the average will be pulled down. If the 1.0 fc contour line encloses most of the zone with only small peripheral areas below it, the average will likely meet a 1.0 fc requirement. The shape of the 1.0 fc contour relative to the zone boundary tells you at a glance whether compliance is likely before calculating any ratios.
The Polar Candela Plot: The Scale Trap and Everything Else the Spider Web Shows
The polar candela distribution plot — the circular chart that looks like a spider web or a snowflake — is the fingerprint of a luminaire. It shows how the fixture distributes light in every direction. Once you can read it, you can immediately identify beam shape, distribution type, and intensity — but only if you avoid the scale trap.
How the Polar Plot Is Constructed
The polar plot places the luminaire at the center of a circular graph. The angular position around the circle represents the direction of light emission — 0° is straight down (nadir), 90° is horizontal, and (for outdoor reports extending above horizontal) 180° is straight up. The radial distance from the center represents candela intensity — how far the plotted line extends from center at each angle tells you how much light is emitted in that direction. A line pushed far from center at 30° means the fixture emits a lot of light at 30° from vertical (a relatively steep downward angle). A line close to center at 80° means very little light near horizontal.
Example asymmetric polar plot — Note scale rings (500, 1000, 1500, 2000 cd). The same visual "width" at different scales = completely different output.
Reading the Polar Plot — Step by Step
- Read the scale rings first. Before anything else, note what candela value each concentric ring represents. Common scales: 500/1000/1500/2000 cd for smaller fixtures; 5000/10000/15000/20000 cd for high-power fixtures. This is the most important step and the one most often skipped.
- Identify how many planes are plotted. Most fixtures show at least two planes — the 0° plane (along the fixture's long axis, typically solid line) and the 90° plane (across the fixture's short axis, typically dashed). When both lines overlap perfectly, the fixture has symmetric distribution. When they differ significantly, the fixture has asymmetric distribution.
- Read beam width at key angles. The half-peak angle — where candela falls to 50% of maximum — defines the half-beam spread. If maximum candela is 1500 cd and the plot shows the distribution reaching 750 cd at 35°, the half-beam is ±35° from nadir (70° total beam angle).
- Check the 90°+ zone. Any distribution plotted above the 90° line (above horizontal) represents uplight and backlight — the primary sources of sky glow and light trespass. A distribution that reaches far above 90° will have high BUG U and B ratings and potential ordinance violations.
- Verify asymmetry if present. Many outdoor fixtures have asymmetric distribution — more light pushed forward or to one side for application-specific control. The asymmetry should match the installation orientation. A wall-mounted fixture specified with its 0° plane toward the street should show most light output in that direction on the polar plot.
The Identical-Looking, Radically-Different-Output Trap in Practice: You're comparing two competing fixture proposals for a parking lot. Proposal A shows a polar plot that looks wide and powerful — the candela curve extends far from center. Proposal B shows a similarly wide-looking curve. Both appear to deliver broad coverage. Before concluding they're equivalent, check the rings: Proposal A has rings at 1000/2000/3000/4000 cd. Proposal B has rings at 200/400/600/800 cd. Proposal B's fixture produces five times less candela at every angle. The plots looked identical because the scale was different. Proposal A will produce five times the illuminance from the same mounting height. This comparison happens in competitive specification scenarios constantly. Always normalize to lumen output and calculate the actual fc impact before selecting based on visual polar plot appearance.
Zonal Lumen Summary: What the Angular Zones Tell You About Uplight and Waste
The zonal lumen summary is a table in a photometric report that breaks the fixture's total lumen output into angular zones — quantifying how many lumens are emitted in each direction range. This tells you what the polar plot shows visually but in quantified, auditable numbers.
The Standard Angular Zones
Photometric reports typically report zonal lumens in cumulative zones from 0° (nadir): 0–30°, 0–60°, 0–90°, 0–120°, 0–150°, 0–180°. The 90° line is the horizontal plane — the most important reference point for outdoor lighting compliance.
- 0–90° zone (below horizontal): All light emitted below the horizontal plane — toward the ground. For a downward-directed outdoor fixture, this should contain 95%+ of total lumens. Lumens in this zone are doing productive work: illuminating the ground plane below the fixture.
- 90–180° zone (above horizontal = uplight): All light emitted above the horizontal plane — toward the sky. This is wasted light (it never reaches the ground) and sky glow. For a well-designed outdoor LED fixture, uplight should be 0–2% of total lumens. High uplight values increase the BUG U rating and contribute to sky glow measured by dark sky ordinances.
- Backlight zone: Lumens emitted behind the fixture in the forward hemisphere. For a wall pack, light going back toward the wall rather than forward into the parking area. High backlight = high BUG B rating = potential light trespass behind the fixture.
The BUG Connection: How Zonal Lumens Produce BUG Ratings
The BUG rating is calculated directly from the zonal lumen data — specifically from the IES Luminaire Classification System (LCS) which divides luminaire output into 10 geometric zones (Front Low, Front Medium, Front High, Front Very High, Back Low, Back Medium, Back High, Back Very High, Uplight Low, Uplight High). The lumen totals in each LCS zone determine the B, U, and G ratings on a 0–5 scale. This means the BUG rating is not an opinion — it's a deterministic calculation from the fixture's measured photometric data. The relationship: high backlight lumens → high B rating; any significant uplight lumens → high U rating; high lumens in the front-high angular zone (70–90° from nadir, aimed forward at eye level) → high G rating.
The BUG Rating System: B, U, and G Decoded for Code Compliance
BUG ratings — Backlight, Uplight, Glare — replaced the older "cutoff/full cutoff/semi-cutoff" classification system in 2007. Many ordinances still reference the old cutoff terminology, but modern photometric reports use BUG. Understanding the translation between old and new, and what each BUG value means for code, is essential for both plan reading and fixture specification.
Backlight — Light Trespass Metric
Lumens emitted in the zone behind the fixture — specifically in the back hemisphere (90° to 270° horizontal rotation from the fixture's forward direction). B is the primary metric for predicting light trespass onto adjacent properties behind the fixture's mounting location.
The 0–5 scale:B0 = minimal backlight. B5 = substantial backlight. Most dark sky ordinances and light trespass codes specify B ≤ 2 or B ≤ 3 maximum. B0–B2 are generally acceptable for most residential-adjacent applications.
Old classification equivalent:Full Cutoff fixtures (no light above 90°) typically rated B0–B1. Standard Cutoff rated B1–B2. Non-cutoff fixtures rated B3–B5.
Uplight — Sky Glow Metric
Lumens emitted at or above the horizontal plane (90° and higher from nadir) — directly into the sky. This is the primary contributor to sky glow and the metric most rigorously controlled by dark sky ordinances, IDA International Dark Sky Community certifications, and observatories' lighting restrictions.
The 0–5 scale:U0 = no measurable uplight (ideal for dark sky compliance). U5 = significant uplight. Most dark sky ordinances require U0 or U1. IDA certification requires U0 for most applications. Well-designed full-cutoff LED fixtures typically achieve U0.
Why the BUG system improved on cutoff:The old cutoff system was based on relative lamp lumens, making it unsuitable for LED (which has no separate "lamp lumen" value from the luminaire lumens). The BUG system uses total fixture lumens — applicable to all source types. This matters when reading older plans vs newer ones.
Glare — High-Angle Brightness Metric
Lumens emitted in the high-angle forward zone — specifically lumens at 60°–90° from nadir in the forward direction (the zone where a person approaching the fixture sees it at the most uncomfortable viewing angle). G is the primary metric for predicting glare discomfort — the "squinting" sensation from bright light at eye level angles.
The 0–5 scale:G0 = minimal forward glare. G5 = high glare. Glare is associated with reduced visibility despite high fc values — over-lit areas with high G ratings can actually reduce functional visibility by washing out contrast. Many ordinances now specify G ≤ 2 maximum for pedestrian-accessible areas.
Glare and the uniformity relationship:A high G fixture creates visual fatigue and reduces the perceived benefit of high fc values. Lower fc with G0–G1 is functionally better than higher fc with G3–G4 for pedestrian comfort and safety. This is why the uniformity ratio (including glare impact) matters more than maximum illuminance for pedestrian spaces.
IES Distribution Types I–V: What the Type Classification Means for Fixture Selection
The IES Luminaire Classification System uses Type designations (Type I through Type V, plus VS) to describe the lateral spread pattern of outdoor luminaires — originally developed for roadway lighting but now used for all outdoor area lighting. Understanding the Types helps you match fixture distribution to application geometry.
| IES Type | Lateral Spread Pattern | Typical Application | What It Looks Like on the Plan |
|---|---|---|---|
| Type I | Very narrow — 1–1.5 pole spacings wide. Elongated oval along the road/path axis. | Narrow walkways, bike paths, narrow roadways where light must stay within the path width | Narrow elongated oval footprint, stays within the path, minimal spill to sides |
| Type II | Narrow to medium — approximately 1.75 pole spacings wide. Moderate lateral spread. | Side-of-road mounting, one-side-of-road paths, narrow parking aisles | Slightly wider oval, biased toward one side if asymmetric, moderate side coverage |
| Type III | Medium — approximately 2.75 pole spacings wide. Standard area lighting distribution. | Parking areas, medium-width roads, general area lighting from side-mounted poles | Wider oval, good center coverage with extending arms; most common parking lot fixture type |
| Type IV | Wide — forward-biased distribution, maximum light pushed forward from mounting point | Building perimeter floodlighting, wall-mounted applications, end-of-aisle parking coverage | Strong forward projection, high-intensity front lobe, reduced rear light |
| Type V | Circular — symmetric in all horizontal directions. Square or circular coverage pattern. | Center-of-parking-lot poles, open area illumination, intersection lighting | Equal light in all directions, circular illumination ring on photometric plan |
| Type VS (Very Short) | Circular but very compact — light falls close to the fixture, minimal spread | High mounting height applications where Type V spreads too far | Small circular footprint close to the pole base |
IES Types are descriptive classifications — a fixture labeled Type III in one manufacturer's specifications may not produce identical distribution to another's Type III. The actual distribution is defined by the polar plot and IES data file, not the Type label. Type is a useful first-level selection criterion; the actual photometric file determines real-world performance. Scroll right on mobile.
How Type Classification Helps You Select the Right Fixture for a Layout
For a parking lot photometric plan, matching fixture type to pole arrangement dramatically affects how well the coverage fills the space. A 300-foot wide lot with poles along one edge needs Type IV fixtures (strong forward throw) to reach the far end. A centrally-positioned pole in a square lot needs Type V (circular coverage). Placing a Type III fixture on a center-lot pole creates an asymmetric elongated oval footprint that misses the corners — which shows up as dark spots on the photometric plan. The relationship between pole position and fixture type is one of the first design checks when evaluating whether a photometric plan layout is appropriate before running the calculation numbers.
The Work Plane Problem: How Plans Produce Inflated, Non-Compliant Numbers
The work plane height is the single most important setting in a photometric calculation — and the one most susceptible to manipulation, whether intentional or accidental. Changing this one setting changes every fc value on the plan without modifying a single fixture position or specification.
What the Work Plane Is and Why Height Matters
The work plane is the horizontal surface at which photometric software calculates illuminance. Light intensity follows the inverse square law: illuminance decreases by the square of the distance from the source. A fixture mounted at 20 feet above a surface produces four times the illuminance at a surface 10 feet below it compared to a surface 20 feet below it (the same distance as its full mounting height).
For outdoor site lighting, the work plane should be set at grade level (0 inches or the actual finished grade elevation). This measures illuminance at the ground surface where people walk, drive, and where code requirements apply. Setting the work plane higher than grade produces inflated fc values that are technically calculated at a point above the ground — not at the surface that code requirements address.
The Inflation Mechanism in Practice
A parking lot pole fixture at 20-foot mounting height producing 2.0 fc at grade (work plane = 0) might show 2.4 fc if the work plane is set to 30 inches (the typical indoor office desk height). The numbers look similar but the 30-inch calculation doesn't represent actual ground-level illuminance. On a plan that barely meets a 2.0 fc average code minimum, this 20% inflation is the difference between apparent compliance and actual compliance.
Always check the plan notes and calculation settings for the work plane height specification. For outdoor site lighting plans, the work plane must be at 0 inches (grade) or the actual finished grade elevation. Any outdoor photometric plan with work plane set above 6 inches should be questioned — and the calculation should be re-run at grade if there's doubt. Municipal inspectors at sophisticated AHJs now routinely check work plane settings in photometric submittals specifically because of this inflation issue. A photometric plan that shows comfortable compliance margin at 30-inch work plane may fail when recalculated at grade. Plans can be re-run in AGi32, DIALux, or other software by simply changing this one setting.
Light Trespass Calculations at Property Lines: What "0.0 fc" Really Means
Light trespass — artificial light crossing a property line and illuminating an adjacent property — is one of the most commonly regulated outdoor lighting parameters. Many ordinances require "0.0 fc at the property line" or "maximum 0.5 fc at the property line." Understanding what these numbers actually mean and their practical limits is essential for both compliance and realistic expectation-setting.
No outdoor lighting system produces literally 0.0 fc at the property line — any fixture with output above zero will produce some measurable illuminance at any finite distance, however small. "0.0 fc" in a photometric report means the calculated illuminance at the property line rounds to 0.0 when displayed to one decimal place — meaning it is less than 0.05 fc. This is the practical de minimis threshold that photometric software and ordinances treat as "no measurable trespass."
The real compliance question: is the illuminance at the property line below the ordinance's stated maximum, and has the calculation been run with the grid points extending beyond the property line (not just to it)?
A critical check: many photometric submittals define the calculation zone boundary exactly at the property line — so the plan shows fc values up to the property line but not beyond it. This tells you the maximum illuminance at the line but not how the light distributes beyond the property. Requesting that the calculation zone extend 10 feet beyond the property line into the adjacent property is the correct way to evaluate actual light trespass rather than just the edge value.
Common Light Trespass Standards by Ordinance Type
- Adjacent to residential zones: Typically 0.1–0.5 fc maximum at property line. Some ordinances specify horizontal and vertical components separately for upper-floor window exposure (see the Newport Beach code example: "horizontal and vertical projection of photometric data is required" for installations within 50 feet of upper-level living units).
- Adjacent to non-residential zones: Typically 0.5–1.0 fc maximum at property line
- General "no measurable trespass": Means ≤0.1 fc at property line in photometric software
- Dark sky overlay districts: May require 0.0 fc (≤0.05 fc) at property boundary in all directions including vertical
For landscape lighting projects near property boundaries, the light trespass calculation at the fence or property line is the primary compliance check, particularly in HOA-governed communities where neighbor complaints about light trespass from landscape uplights, spotlights, and path lights are common. See the fix light trespass guide for practical solutions when existing landscape lighting is creating trespass issues.
Permit Submittal: What Code Inspectors Actually Check and Four Common Rejection Reasons
When a photometric plan is submitted as part of a commercial lighting permit application, the reviewer checks specific items. Understanding what inspectors look for — and the four most common reasons plans are rejected — helps avoid costly resubmittal cycles.
What the Permit Inspector Actually Verifies
A permit reviewer checking a photometric plan submittal typically confirms:
- The calculation zone summary shows average and minimum fc values meeting or exceeding the local ordinance's minimum illuminance requirements for the applicable zone type (parking, pedestrian, service area)
- The uniformity ratio (Avg:Min or Max:Min) is within the ordinance's stated maximum
- The property line calculation values do not exceed the light trespass maximum — and that the calculation grid extends to or beyond the property line
- The fixture schedule specifies actual products (not "to be determined") with IES files from the manufacturer — not generic or estimated data
- The mounting heights on the plan match the heights in the calculation settings and fixture schedule
- The work plane height is appropriate for the application (at grade for outdoor)
- BUG ratings are within the ordinance's specified maximums (where BUG limits are adopted)
- The fixture cut sheets confirm the products specified are actually available and listed
✗ Rejection #1: Generic or Missing IES Files
The most common rejection reason for commercial lighting permits: the photometric plan was generated using a generic IES file (not the actual manufacturer-specific file for the specified fixture), or the plan notes do not document which IES file was used. Reviewers increasingly verify that the IES file metadata matches the fixture specification. A plan generated with a "generic 100W LED area light" IES file rather than the specific fixture model's certified IES data is invalid — the calculated results do not represent actual fixture performance. Request the IES file filename and manufacturer LM-79 test report reference for every fixture specified.
✗ Rejection #2: Calculation Zone Doesn't Extend to Property Line
The calculation zone is defined only within the project boundary, showing no values at or beyond the property line. The inspector cannot verify light trespass compliance without property line values. Some plans show iso-footcandle contours crossing the property line without providing numeric values at that crossing. The correct submittal extends the calculation grid a minimum of 10 feet beyond all property lines adjacent to other occupied properties and shows the fc values at those points in the calculation zone summary.
✗ Rejection #3: Work Plane Set to Non-Grade Height
An outdoor site plan with work plane set to 30 inches (office desk height) or other above-grade elevation — typically discovered when the reviewer checks plan notes. The plan may show apparent compliance at elevated work plane but fail at grade. Increasingly, AHJs for outdoor lighting specifically require the plan notes to state "Work Plane: 0.0 feet (grade)" or equivalent. Some municipalities have added this requirement to their lighting ordinance submittal checklists specifically because of past abuse.
✗ Rejection #4: Uniformity Ratio Exceeds Maximum
The average fc meets the minimum requirement but the average-to-minimum uniformity ratio exceeds the code's maximum (e.g., plan shows 4.5:1 where ordinance requires 4:1 or better). This often happens when fixtures are spaced too widely, leaving large dark zones between poles that pull the minimum below the acceptable range while the average under poles is high. Fixing this requires either closer fixture spacing, higher-output fixtures, or different distribution types (switching from Type III to Type V for example) — all of which require redesign and recalculation.
The IES file problem comes up constantly on commercial landscape and site lighting permits. The designer specifies a generic "150W LED parking fixture" in the photometric software using whatever IES file was readily available, not the actual fixture they intend to specify. The permit goes through because the plan shows compliance. Then the actual fixture is ordered — different IES file, different distribution, different output — and field measurements at completion show 30% lower average fc than the plan predicted. The permit is technically for what was calculated, not what was installed. Correct practice: use manufacturer-provided, LM-79 tested IES files from the actual product being specified. Many manufacturers provide these files on their product pages. If a product doesn't have a manufacturer IES file, that's a red flag about its suitability for professional specification.
Photometrics for Landscape Lighting: What Changes at the Residential and Low-Voltage Scale
Most photometric plan guides focus on commercial parking lots and large-scale site lighting. The same principles apply to residential landscape lighting — but with different target illuminance levels, different code requirements, and different practical tools for generating and reviewing the data.
Photometric plans are often used to verify more than decorative lighting performance. In some projects, designers must also demonstrate that pathways, exit routes, and circulation areas maintain adequate illumination under emergency conditions. The emergency backup lighting and egress pathway guide explains how emergency visibility requirements influence lighting design, fixture placement, and pathway illumination planning.
Target Illuminance Levels for Landscape Lighting Zones
IES recommended practice for residential landscape and exterior lighting (IES RP-33) provides the reference levels for residential outdoor spaces. These are professional recommendations, not mandatory codes, but they inform what a photometric plan for landscape lighting should demonstrate:
- Residential pedestrian pathways (low activity): 0.5–1.0 fc average, 0.1 fc minimum, 4:1 Avg:Min uniformity. A path lit to 1.0 fc average with 4:1 uniformity has no point below 0.25 fc — sufficient for safe walking without creating visual contrast problems.
- Residential entry areas: 1.0–3.0 fc average — enough for safe transition from pathway to entry, recognition of guests, and key entry.
- Steps and stair landings: 2.0–5.0 fc at tread level — required for safe footing on grade changes. Step lighting directly at riser level provides the most effective illuminance with the least glare. See the landscape lighting design guide and the lumen guide for landscape-specific illuminance targets.
- Ornamental accent lighting (uplights, tree lighting): 5–15 fc on the surface being illuminated — though the concern here is often too much rather than too little. See the beam spread guide for the relationship between beam angle and surface illuminance for landscape spotlights.
When Residential Landscape Lighting Needs a Photometric Plan
Standard single-family residential landscape lighting does not require photometric plan submittal in most jurisdictions. Exceptions where a photometric plan may be required:
- Properties in HOA communities with outdoor lighting standards requiring demonstrated compliance
- Coastal properties where light trespass toward sea turtle nesting habitat must be documented — see the turtle-safe lighting codes guide
- Properties in formally designated dark sky overlay zones
- Large residential estates being developed under commercial-scale permits
- Properties adjacent to sensitive uses (wildlife habitat, observatories) where light trespass documentation is required
The Voltage Drop and Photometric Interaction — A Landscape Lighting-Specific Issue
Photometric plans for landscape lighting assume the fixtures receive their rated input voltage — typically 12V AC. When voltage at the fixture drops below rated voltage due to voltage drop in the wire run, LED fixture output drops proportionally. A fixture calculated to produce 450 lumens at 12V may produce only 350 lumens at 10.8V — reducing the actual illuminance by 22% compared to the photometric plan calculation. This means voltage drop directly affects whether a landscape lighting photometric plan accurately predicts field performance. For any landscape project where photometric calculations matter (HOA compliance, ordinance compliance), voltage drop calculations should precede and inform the photometric study. See the voltage drop guide, the voltage drop calculator, and the voltage drop code requirements guide for the complete voltage management framework.
Photometric Plan Reading FAQ
What is the difference between foot-candles and lux on a photometric plan?
Both measure illuminance — the amount of light falling on a surface — but in different units. Foot-candles (fc) measure lumens per square foot; lux measures lumens per square meter. The conversion is 1 fc = 10.76 lux. US building codes and IES recommended practices cite foot-candles in most US publications. If you receive a plan in lux and need to compare it to a code minimum in fc, divide the lux value by 10.76. A plan showing 5.4 lux average equals 0.5 fc average. Most outdoor site lighting plans for US permit submittal use foot-candles. Interior lighting plans may use either, depending on the design software's settings. Always check the unit labels on the calculation grid — confusing lux with fc by a factor of 10 is a surprisingly common error when reviewing plans from international consultants.
What is an IES file and why does it matter for photometric accuracy?
An IES file (extension .ies) is a standardized digital file format defined by the Illuminating Engineering Society that contains the measured photometric data for a specific luminaire — every candela value measured at every vertical and horizontal angle during testing on a goniometer. Photometric software uses IES files to simulate how a fixture distributes light in a space. The critical accuracy issue: a photometric plan is only as accurate as the IES file used to generate it. Plans generated from generic, estimated, or incorrect IES files produce unreliable results that may appear compliant but won't match actual field performance. Reputable manufacturers provide IES files tested to IES LM-79-19 standards. IES files can be opened in free tools like Photometric Toolbox or AGi32 to verify their data before using them in a photometric study. A manufacturer unable or unwilling to provide an LM-79 tested IES file for a specified product is a red flag for the product's specification suitability.
What is a uniformity ratio and what values are code-compliant?
The uniformity ratio describes how evenly light is distributed across a space. The Avg:Min ratio is Average fc ÷ Minimum fc — a lower number means more even distribution. For example, 2.4 fc average ÷ 0.6 fc minimum = 4:1 Avg:Min. A Max:Min ratio uses the maximum fc in the numerator instead of average. IES RP-20 recommends 4:1 Avg:Min maximum for commercial parking areas. Pedestrian paths typically target 4:1 or better. Many municipal ordinances specify Max:Min ≤ 10:1 for parking as the code maximum. Research from the Lighting Research Center at RPI demonstrated that users perceived better safety with more uniform light at lower average levels — making the uniformity ratio functionally more important than the average fc level in many pedestrian applications. Excessively high uniformity ratios (10:1+) indicate bright spots surrounded by dark areas, which creates visual contrast that reduces effective visibility even when the average meets the code minimum.
What does LM-79 vs LM-80 mean in a photometric context?
LM-79 and LM-80 are two different IES measurement standards that answer different questions about LED fixture performance: LM-79-19 (Approved Method: Optical and Electrical Measurements of Solid-State Lighting Products) measures a fixture's photometric performance at a single point in time — total lumens, spatial distribution, color metrics. The IES file for a fixture is generated from LM-79 testing. This is what's used in photometric software to calculate the fc grid on a plan. LM-80 measures LED lumen depreciation over thousands of hours — how much the LED output decreases with time. Combined with IES TM-21 projections, LM-80 data estimates how bright a fixture will be in 50,000 hours. For permit submittal, LM-79 data matters — it produces the IES file used in calculations. LM-80 data matters for long-term performance assurance and warranty documentation, but doesn't directly affect the photometric plan numbers (except through the Light Loss Factor, which can incorporate projected lumen depreciation).
Why doesn't my landscape lighting look as bright as the photometric plan predicted?
Four possible causes, in order of frequency: (1) Voltage drop — landscape lighting operating at 10.8V instead of 12V produces significantly less output than the photometric calculation assumed. Calculate actual voltage at each fixture using the voltage drop calculator and verify it matches the fixture's rated input. (2) Incorrect IES file — the photometric study used a different fixture's data than what was installed, or used a generic IES file. (3) Light loss factor not applied — the plan showed "day one" output without LLF reduction, and the installed system at a few weeks of operation is already slightly below new output due to thermal settling of LED drivers. (4) Fixture orientation — spotlights or uplights installed in the wrong orientation relative to the photometric study assumption, directing the beam where it wasn't calculated. Check these four variables before assuming the design itself is wrong.